eyeQ: this successful call triggers tactical trading signal
Experts at eyeQ use AI and their own smart machine to analyse macro conditions and generate actionable trading signals. Has this FTSE 100 stock risen too far?
17th November 2026 09:32
by Huw Roberts from eyeQ
“Our signals are crafted through macro-valuation, trend analysis, and meticulous back-testing. This combination ensures a comprehensive evaluation of an asset's value, market conditions, and historical performance.” eyeQ
- Discover: eyeQ analysis explained | eyeQ: our smart machine in action | Glossary
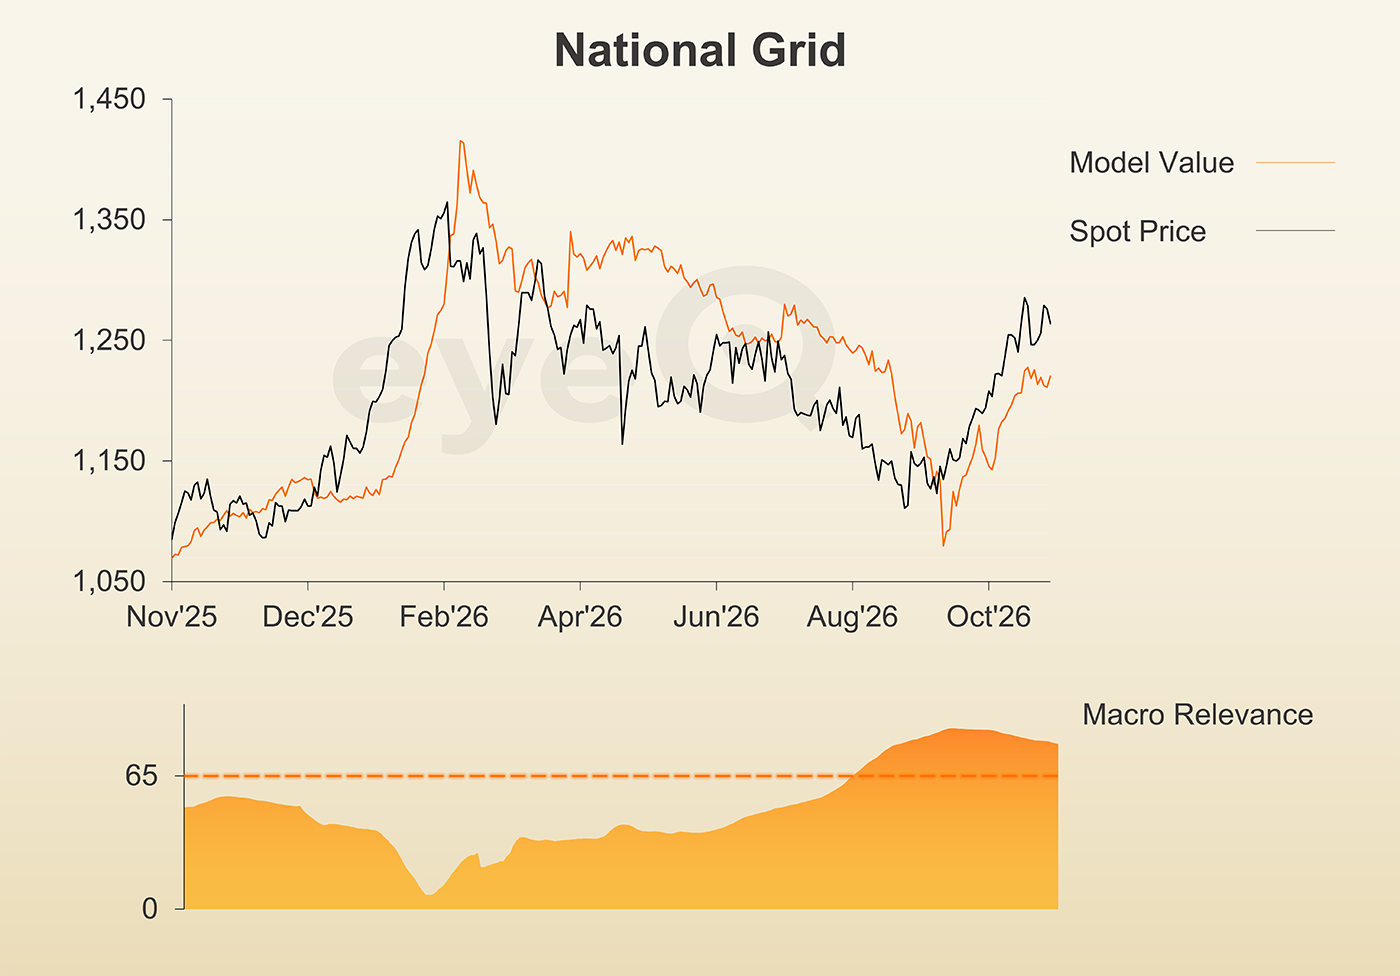
National Grid
Macro Relevance: 87%
Model Value: 1,220.47p
Fair Value Gap: +3.44% premium to model value
Data correct as at 17 November 2026. Please click glossary for explanation of terms. Long-term strategic model.
At the start of September, eyeQ noted that National Grid (LSE:NG.) had sold off too far relative to macro conditions and fired a bullish signal. The stock has risen 11.5% since then.
Now, however, the macro view has shifted and the risk is that this bounce has run too far, too quickly.
First, the good news. Over October, macro turned into a positive for NG - eyeQ model value rose nearly 11%.
In the last few weeks though, that bounce has stalled around the 1,200p area. That’s because October’s gains came largely from the bond market. Falling real yields, lower rate volatility and relative calm in European bond markets after weeks of stress coming from France’s fiscal outlook, were all tailwinds.
More recently, some of these concerns have come back. Meanwhile, the share price has continued to forge ahead. The result is a +3.4% fair value gap that’s big enough to trigger a new bearish signal.
It’s important to note that this is bearish in the sense that the stock has moved too fast relative to macro fundamentals. But those fundamentals have not started to trend lower. They could, but equally this could simply be a pause for breath before the uptrend resumes.
The point is that this is a tactical signal for existing owners to think about top-slicing rather than a big new bearish warning. In terms of the longer investment horizon, eyeQ model value will provide the tell.
Source: eyeQ. Past performance is not a guide to future performance.
Useful terminology:
Model value
Where our smart machine calculates that any stock market index, single stock or exchange-traded fund (ETF) should be priced (the fair value) given the overall macroeconomic environment.
Model (macro) relevance
How confident we are in the model value. The higher the number the better! Above 65% means the macro environment is critical, so any valuation signals carry strong weight. Below 65%, we deem that something other than macro is driving the price.
Fair Value Gap (FVG)
The difference between our model value (fair value) and where the price currently is. A positive Fair Value Gap means the security is above the model value, which we refer to as “rich”. A negative FVG means that it's cheap. The bigger the FVG, the bigger the dislocation and therefore a better entry level for trades.
Long Term model
This model looks at share prices over the last 12 months, captures the company’s relationship with growth, inflation, currency shifts, central bank policy etc and calculates our key results - model value, model relevance, Fair Value Gap.
These third-party research articles are provided by eyeQ (Quant Insight). interactive investor does not make any representation as to the completeness, accuracy or timeliness of the information provided, nor do we accept any liability for any losses, costs, liabilities or expenses that may arise directly or indirectly from your use of, or reliance on, the information (except where we have acted negligently, fraudulently or in wilful default in relation to the production or distribution of the information).
The value of your investments may go down as well as up. You may not get back all the money that you invest.
Equity research is provided for information purposes only. Neither eyeQ (Quant Insight) nor interactive investor have considered your personal circumstances, and the information provided should not be considered a personal recommendation. If you are in any doubt as to the action you should take, please consult an authorised financial adviser.
These articles are provided for information purposes only. Occasionally, an opinion about whether to buy or sell a specific investment may be provided by third parties. The content is not intended to be a personal recommendation to buy or sell any financial instrument or product, or to adopt any investment strategy as it is not provided based on an assessment of your investing knowledge and experience, your financial situation or your investment objectives. The value of your investments, and the income derived from them, may go down as well as up. You may not get back all the money that you invest. The investments referred to in this article may not be suitable for all investors, and if in doubt, an investor should seek advice from a qualified investment adviser.
Full performance can be found on the company or index summary page on the interactive investor website. Simply click on the company's or index name highlighted in the article.