Here's what might happen next to BP's share price
After running his charts again, independent analyst Alistair Strang reveals what they tell us about potential share price trends at the oil major.
11th June 2026 06:55
by Alistair Strang from Trends and Targets

In April, we speculated that BP (LSE:BP.)'s share price would fall to 500p if it dipped below a trigger level of 531p. Thankfully – from our perspective – the share price agreed with our calculations, hitting an exceedingly precise 500p on 26 May and bouncing a little bit thereafter. This is perhaps good, but we’re going 'Back to School' briefly with the charts below.
- Invest with ii:Open a Stocks & Shares ISA | Top ISA Funds | Transfer your ISA to ii
BP has a very obvious blue downtrend, dating back to 2018. This particular downtrend was confirmed, repeatedly, by the market, and when the share price broke upward in March of this year, we experienced a small gust of optimism, the sort of thing that's usually the harbinger of a happy future.
Unfortunately, the US President had other ideas, a cunning plan to boost the price of oil and thus, US revenues. Unfortunately, the cunning plan is falling apart and, as the lower chart extract below exhibits, confidence in the price of BP shall diminish, along with the price of crude oil.
The funny thing, the US President is able to say: “Not my fault Guv, it’s entirely the other guy to blame!”. But as we see confidence in artificially inflated prices diminish, it’s also reasonable to anticipate the price of oil reversing soon and affecting BP's share price. This is doubly important as the US needs “a win” to give sufficient propaganda for the upcoming US mid-term elections.
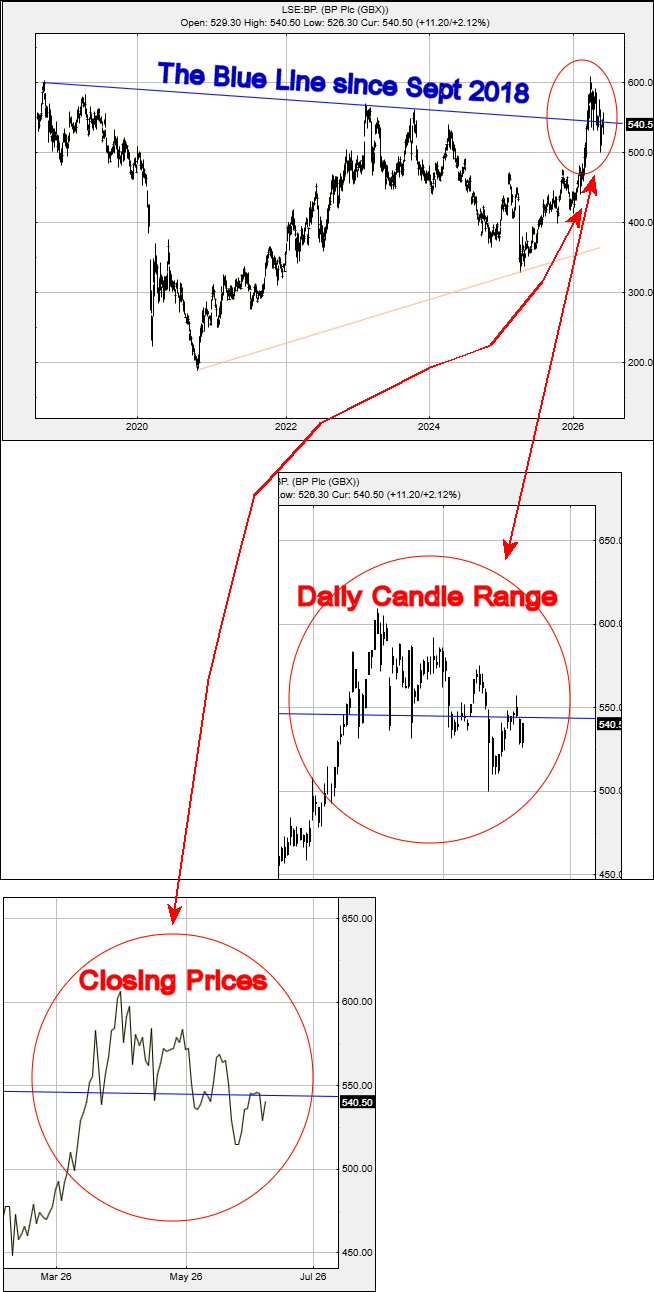
Source: Trends and Targets. Past performance is not a guide to future performance.
Therefore, if we anticipate some amateur dramatics with oil prices, BP has a share price which is poised for some fun.
From a near-term perspective, eyebrows should twitch if the share price falls below just 515p. Movement such as this is currently capable of driving reversals to an initial 490p with our secondary, if broken, calculating down at 459p along with a valid argument for a bounce.
The crazy thing is, this should see US crude back in the $50 range, along with Brent splashing around in the low 60’s. But for BP, if our calculation of a “bottom” at 459p breaks, we can present a visually absurd potential at 387p. Unfortunately, it’s not that absurd, given it matches prices in 2025 before the Strait of Hormuz became a no boating zone.
The somewhat annoying calculation with BP is the price level of 550p, share price closure above which is capable of targeting a “surprise” rise to an initial 652p with secondary, if bettered, an eventual 721p.
We think, with the USA and looming elections, oil prices shall be forced to reverse, probably give the major oil shares a bit of a hammering and, in BP’s case, a hopeful bounce point at 459p.
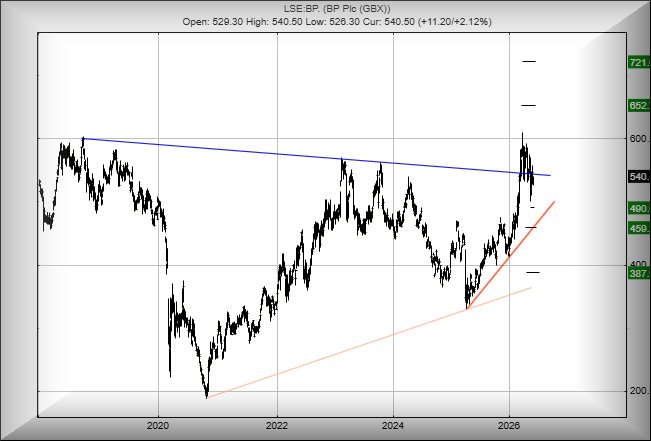
Source: Trends and Targets. Past performance is not a guide to future performance.
Alistair Strang has led high-profile and "top secret" software projects since the late 1970s and won the original John Logie Baird Award for inventors and innovators. After the financial crash, he wanted to know "how it worked" with a view to mimicking existing trading formulas and predicting what was coming next. His results speak for themselves as he continually refines the methodology.
Alistair Strang is a freelance contributor and not a direct employee of Interactive Investor. All correspondence is with Alistair Strang, who for these purposes is deemed a third-party supplier. Buying, selling and investing in shares is not without risk. Market and company movement will affect your performance and you may get back less than you invest. Neither Alistair Strang or Interactive Investor will be responsible for any losses that may be incurred as a result of following a trading idea.
These articles are provided for information purposes only. Occasionally, an opinion about whether to buy or sell a specific investment may be provided by third parties. The content is not intended to be a personal recommendation to buy or sell any financial instrument or product, or to adopt any investment strategy as it is not provided based on an assessment of your investing knowledge and experience, your financial situation or your investment objectives. The value of your investments, and the income derived from them, may go down as well as up. You may not get back all the money that you invest. The investments referred to in this article may not be suitable for all investors, and if in doubt, an investor should seek advice from a qualified investment adviser.
Full performance can be found on the company or index summary page on the interactive investor website. Simply click on the company's or index name highlighted in the article.