eyeQ: important information on Tesco’s prospects
Experts at eyeQ use AI and their own smart machine to analyse macro conditions and generate actionable trading signals. Here’s what it reveals about the buoyant share price.
8th October 2026 10:12
by Huw Roberts from eyeQ

“Our signals are crafted through macro-valuation, trend analysis, and meticulous back-testing. This combination ensures a comprehensive evaluation of an asset's value, market conditions, and historical performance.” eyeQ
- Discover: eyeQ analysis explained | eyeQ: our smart machine in action | Glossary
Tesco
Macro Relevance: 15%
Model Value: 472.54p
Fair Value Gap: +4.52% premium to model value
Data correct as at 8 October 2026. Please click glossary for explanation of terms. Long-term strategic model.
Tesco (LSE:TSCO) shares are bouncing this morning after the grocer raised the lower end of its profit forecasts. It still had some health warnings such as geopolitical tensions and the cost-of-living crisis, but, overall, the mood music was reasonably upbeat. Share buybacks, improving online sales, and strong showing from the Clubcard loyalty scheme were all contributing to the good news.
eyeQ’s macro relevance score for Tesco is just 15%. We have no problem advertising a model with low confidence - there’s still important information in that.
Right now, macro explains little of day-to-day price action; company news is more important right now. That means understanding the issues above, like how Clubcard helps retain loyal customers, and how price matching with Aldi is helping squeezed shoppers, is the most important research investors can do.
The other beauty with eyeQ’s model is that it gives you a clear picture in seconds. In this instance, model value has been treading water around 460-470p for two months now. There is no clear trend from macro forces, instead it’s a neutral picture. That means the latest rally has taken the stock into rich territory on our metrics.
Low macro relevance precludes any signal but is a quick, efficient way to let investors know that while macro isn’t dominant right now, it is suggesting a fair degree of good news is now in the price.
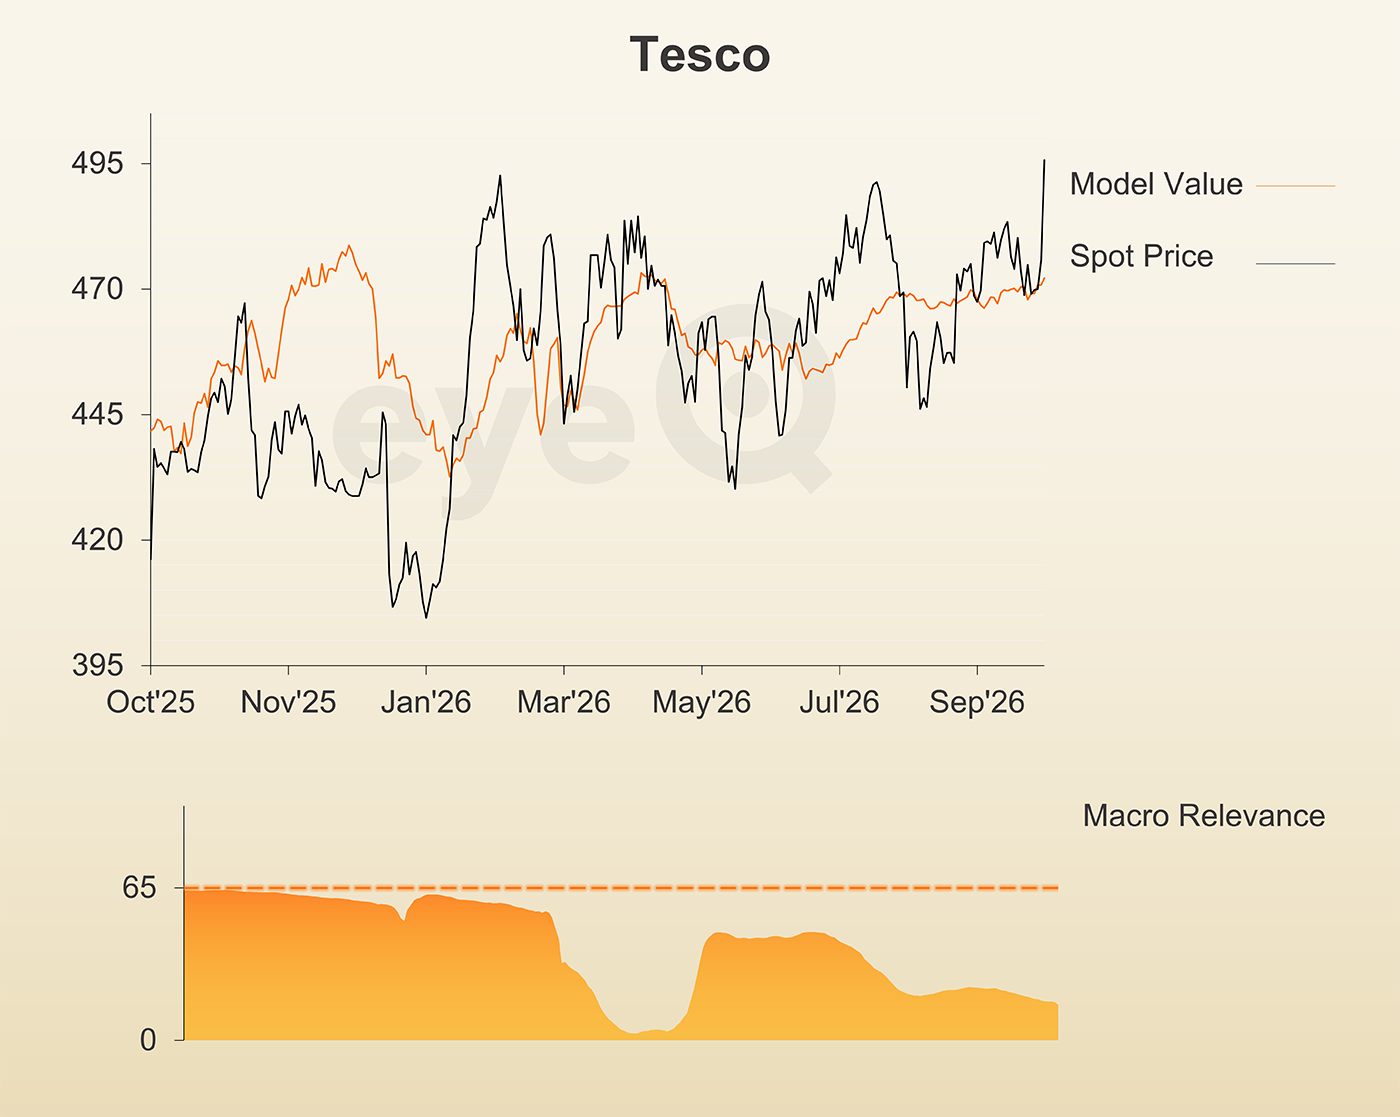
Source: eyeQ. Past performance is not a guide to future performance.
Useful terminology:
Model value
Where our smart machine calculates that any stock market index, single stock or exchange-traded fund (ETF) should be priced (the fair value) given the overall macroeconomic environment.
Model (macro) relevance
How confident we are in the model value. The higher the number the better! Above 65% means the macro environment is critical, so any valuation signals carry strong weight. Below 65%, we deem that something other than macro is driving the price.
Fair Value Gap (FVG)
The difference between our model value (fair value) and where the price currently is. A positive Fair Value Gap means the security is above the model value, which we refer to as “rich”. A negative FVG means that it's cheap. The bigger the FVG, the bigger the dislocation and therefore a better entry level for trades.
Long Term model
This model looks at share prices over the last 12 months, captures the company’s relationship with growth, inflation, currency shifts, central bank policy etc and calculates our key results - model value, model relevance, Fair Value Gap.
These articles are provided for information purposes only. Occasionally, an opinion about whether to buy or sell a specific investment may be provided by third parties. The content is not intended to be a personal recommendation to buy or sell any financial instrument or product, or to adopt any investment strategy as it is not provided based on an assessment of your investing knowledge and experience, your financial situation or your investment objectives. The value of your investments, and the income derived from them, may go down as well as up. You may not get back all the money that you invest. The investments referred to in this article may not be suitable for all investors, and if in doubt, an investor should seek advice from a qualified investment adviser.
Full performance can be found on the company or index summary page on the interactive investor website. Simply click on the company's or index name highlighted in the article.