Time to modernise your view on this trust sector?
A Kepler analyst examines infrastructure - one of the greatest success stories in the investment trust industry - and the evolution in the types of assets such trusts can own.
19th June 2026 14:01
by Alan Ray from Kepler Trust Intelligence

This content is provided by Kepler Trust Intelligence, an investment trust focused website for private and professional investors. Kepler Trust Intelligence is a third-party supplier and not part of interactive investor. It is provided for information only and does not constitute a personal recommendation.
Material produced by Kepler Trust Intelligence should be considered a marketing communication, and is not independent research.
Had you been around at the time You Can’t Always Get What You Want was released in 1969, you could be forgiven for thinking that the Rolling Stones was a band that maybe had a couple more years left in it. A dangerous rock and roll band working with a classical choir sounds like it’s closer to the end than the beginning.
But here we are in 2026 with the Stones’ latest single, accompanied by an official deepfake video, getting daily airplay on mainstream radio. And whereas the A side of that single takes in modern production techniques that make it sit easily against a backdrop of much younger bands, the B side sounds like an outtake from a session back in the 1960s. So, extraordinary longevity, and yet moving with the times, but a core proposition that is unchanged. Leading us quite neatly to the listed infrastructure sector.
Rising interest rates ended a golden era for infrastructure trusts and other so-called bond proxy income trusts. For many years, these trusts could raise new capital almost on demand as investors sought higher returns than were on offer from government bonds. This was all taken away in 2022, and the infrastructure trusts’ premiums turned to discounts. That, of course, is extremely well-documented in the pages of many Kepler research reports.
Whether you are a music aficionado or an investment trust historian, the past can be fascinating and teach us many things. But just like in our introduction, it can lead us to make torturous parallels, and we risk anchoring ourselves to what has gone before. After a seismic shift, we might spend some time waiting for things to return to ‘normal’ before it dawns on us that there’s no such thing. Is it time to change our frame of reference for infrastructure trusts?
The sector turned 20 years old in March this year, but the last five of those have, in our view, seen the most rapid evolution. The chart below remains an incredibly useful tool, looking at the yield spread of an infrastructure investment trust over UK government bonds. But is it quite as useful as it would have been back in 2006?
Here we’ve unapologetically picked HICL Infrastructure PLC Ord (LSE:HICL)as the reference, since its IPO was just over 20 years ago and it comfortably meets the definition of being a sector bellwether. Its launch defined what we investment trust investors know about infrastructure investing.
HICL: SPREAD OVER GILTS
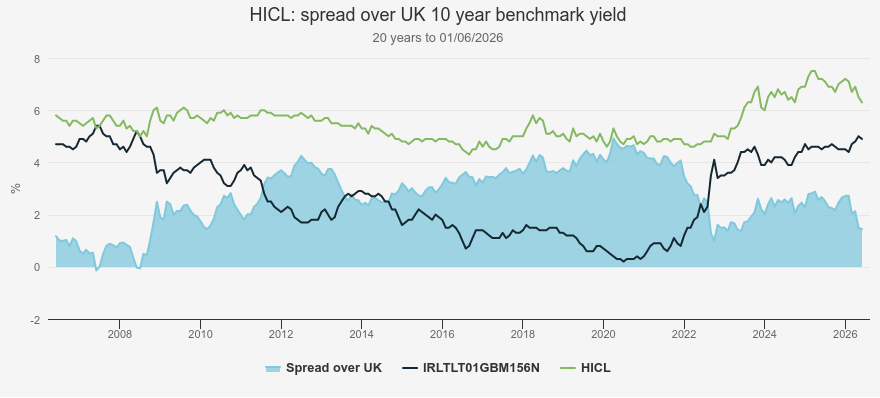
Source: Morningstar
Bearing in mind there was an initial ‘ramp up’ period, for most of the data series above, the HICL proposition was very much ‘government-backed cashflows’, and while yes, there was some inflation-linkage and potential for capital growth, investors’ minds were very much focused on the current yield rather than the growth prospects. So, the spread over gilts would have told you a fair bit about investor sentiment. This remains the case, but as the chart shows, the spread now is lower than it has been for most of HICL’s history. What’s going on?
Let’s start by stepping back in time again, this time by 10 years. The chart below is one way of looking at the classic dilemma that faces income investors, regardless of whether they are investing in equities, infrastructure, or debt: a higher starting dividend vs higher dividend growth. HICL exemplifies the classic steady government-backed-cashflow approach to infrastructure that started it all, whereas the trust we’ve chosen to compare it to, 3i Infrastructure Ord (LSE:3IN), takes a different approach, investing in businesses with infrastructure characteristics.
In the chart, we take HICL as the benchmark for dividend yield and at the start of the series, its yield is rebased to 100. Its rising dividend is tracked by the blue area. 3IN’s yield at the start of this series was lower, and this is proportionally reflected in the lower starting point of the black line, which then rises as 3IN’s dividend grows. This allows one to see how much yield one would have foregone in purchasing 3IN instead of HICL at the start of the period and then how quickly one would have caught up, if one measures yield against the starting price or book cost. Looking at yield this way is probably something a lot of income investors do in their heads, if not on a spreadsheet. Thus, “I bought the shares 10 years ago at 100p, and this year I got dividends of 10p, so I’m very happy, and I don’t look at the current share price too often.”
In reading the chart, treat the numbers as indicative rather than precise. For example, we have used the prevailing net asset values of the two trusts at the start of the series to calculate the starting yields because it is just as likely that an investor would have acquired shares in both through a capital raise at a price close to NAV as to have acquired them at the market price. Given the range of likely prices paid, taking the net asset value as the starting point seems like the closest thing to a level playing field.
3IN and HICL DIVIDEND GROWTH
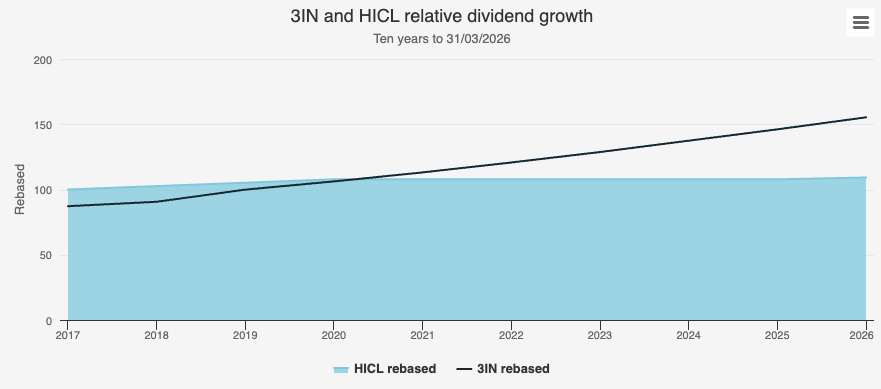
Source: Company Reports
Obviously, this chart shows that the yield investor choosing 3IN 10 years ago would have ended up today with a higher yield compared to their initial cost, but saying that is, first, rear-view mirror investing and second, completely ignores the context at the time. HICL was valued by its shareholders for its ‘bond proxy’ characteristics: government-backed cashflows from highly predictable projects focussed on core areas of infrastructure. In contrast, 3IN’s equity upside and potential for downside put it into a higher-risk category for many shareholders. The reality at the time was that large investors were often not making a choice between the two but putting them into completely different risk categories. It’s no coincidence that, ten years ago, far more of the sector followed the HICL model than the 3IN model, as it’s normally the case that the most influential shareholder groups, wealth managers, and multi-asset funds manage much more money in their low- and medium-risk categories than in higher risk.
Which leads to one important piece of context about the investment trust sector. New investment trust launches are often designed with input from their original investors, and quite a bit of pushing and pulling at the pilot stage prior to an IPO can occur. And in an era of regular capital raises, that influence persisted long after an IPO, with the same investors generally supporting each new raise. The start of the data series above falls right in the middle of an era where the largest investors in the sector wanted ‘alternative income’ to government bonds, rather than equity risk. So, we have a sector and a frame of reference that has been moulded by low interest rates and a certain kind of shareholder.
You might get what you need
Roll forward to 2026, and the infrastructure trusts have seen a significant evolution in who their shareholders are. It’s well known that the giant wealth managers and multi-asset institutional investors are reducing their commitment to the sector. You will still find many of them on the registers of infrastructure trusts, but their size and influence have waned. We’ve moved from an era where strategy is shaped by shareholders with defined risk categorisations to, what we might say is, a more pragmatic group of shareholders who just want the management teams to say what they think the best strategy is, and then get on and deliver it.
Once again taking HICL as the bellwether, in this more pragmatic era, it remains very much focussed on steady, lower-risk investing with a higher dividend but has expanded its capacity to develop projects at an earlier stage and broadened its geographic and sectoral horizons. The capacity for higher returns, both in dividend growth and capital terms, has been building for a while, and we think it will start to show very strongly in the coming years. We also think it is far more likely to find investors placing this alongside 3IN, with its hybrid of infrastructure and private equity, rather than in a different risk bucket. The two are very different, but each can play an anchor role in an equity income portfolio. Going back to our earlier ‘spread over gilts’ chart, we think the market is gradually starting to value HICL’s growth potential alongside its income, and that the narrower-than-average spread isn’t as perplexing as it might seem.
A good illustration of evolving investor attitudes comes from one of the more unique infrastructure investors in the sector. Cordiant Digital Infrastructure Ord (LSE:CORD) listed in 2021, around the time that the clock was running down on the ‘bond proxy’ era. This is very much in the mould of buying operating companies that have infrastructure characteristics and assets, which have the capacity to be expanded through the management teams ‘buy, build, and grow’ approach. CORD focuses on digital infrastructure in areas like fibre optic networks, broadcast towers, and infrastructure. Just like 3IN, the risks are higher, but with that comes the potential for higher rewards, including dividend and capital growth.
One trust that has remained firmly in the income first camp is GCP Infrastructure Investment Ord (LSE:GCP), which, from inception, has invested in the debt rather than equity of social infrastructure projects in the UK. Whereas GCP’s average project size is smaller than average for the sector, which in some cases exposes it to higher risk, it has a very low loss ratio compared to general private credit, and many of its investments are amortising debt. This puts it in a good position to, first, gradually pay down its debt, which it has almost done, second, buy shares back at very attractive discounts, enhancing the NAV and earnings per share, but third, opens the way to gradually reset the portfolio by writing loans at prevailing interest rates. GCP’s wider-than-average discount hints that its ‘bond proxy’ characteristics are still stronger than others, but in its own way, it has a clear path to recovery through the mechanism described above. A different flavour of debt investment into infrastructure comes from the geographically and sectorally more diverse Sequoia Economic Infrastructure Inc Ord (LSE:SEQI), which again, lends to infrastructure projects, and it is primarily focused on generating a high income.
Conclusion
As we have seen, while there is still a broad spread of strategies in the infrastructure sector, and it is still very possible to prioritise high income over dividend growth, there has been a shift to a more balanced total return approach that is more self-sustaining and less dependent on a constant cycle of new capital raises. And possibly more analogous to an equity income fund than a bond fund.
Readers may have noticed how often the topic of infrastructure arises in our coverage of equity trusts. Whether it’s the UK, Europe, the US, or Emerging Markets, companies whose business is associated with infrastructure are woven into the fabric of so many portfolios. From the electrification of economies, data centres (and all the associated control, power, and cabling systems), or the more conventional restoration and upgrading of core infrastructure, the need for capital is vast, and the definition of what constitutes infrastructure is constantly being refreshed.
This serves to highlight that a specialist vehicle able to own and operate the resulting assets over the long term is even more relevant today than it was two decades ago, and the infrastructure sector is one of the greatest success stories of the investment trust sector. Given the evolving nature of these trusts and the assets that they can own and operate, we think the next 20 years will be even more fascinating and rewarding than the last.
Kepler Partners is a third-party supplier and not part of interactive investor. Neither Kepler Partners or interactive investor will be responsible for any losses that may be incurred as a result of a trading idea.
These articles are provided for information purposes only. Occasionally, an opinion about whether to buy or sell a specific investment may be provided by third parties. The content is not intended to be a personal recommendation to buy or sell any financial instrument or product, or to adopt any investment strategy as it is not provided based on an assessment of your investing knowledge and experience, your financial situation or your investment objectives. The value of your investments, and the income derived from them, may go down as well as up. You may not get back all the money that you invest. The investments referred to in this article may not be suitable for all investors, and if in doubt, an investor should seek advice from a qualified investment adviser.
Full performance can be found on the company or index summary page on the interactive investor website. Simply click on the company's or index name highlighted in the article.
Important Information
Kepler Partners is not authorised to make recommendations to Retail Clients. This report is based on factual information only, and is solely for information purposes only and any views contained in it must not be construed as investment or tax advice or a recommendation to buy, sell or take any action in relation to any investment.
This report has been issued by Kepler Partners LLP solely for information purposes only and the views contained in it must not be construed as investment or tax advice or a recommendation to buy, sell or take any action in relation to any investment. If you are unclear about any of the information on this website or its suitability for you, please contact your financial or tax adviser, or an independent financial or tax adviser before making any investment or financial decisions.
The information provided on this website is not intended for distribution to, or use by, any person or entity in any jurisdiction or country where such distribution or use would be contrary to law or regulation or which would subject Kepler Partners LLP to any registration requirement within such jurisdiction or country. Persons who access this information are required to inform themselves and to comply with any such restrictions. In particular, this website is exclusively for non-US Persons. The information in this website is not for distribution to and does not constitute an offer to sell or the solicitation of any offer to buy any securities in the United States of America to or for the benefit of US Persons.
This is a marketing document, should be considered non-independent research and is subject to the rules in COBS 12.3 relating to such research. It has not been prepared in accordance with legal requirements designed to promote the independence of investment research.
No representation or warranty, express or implied, is given by any person as to the accuracy or completeness of the information and no responsibility or liability is accepted for the accuracy or sufficiency of any of the information, for any errors, omissions or misstatements, negligent or otherwise. Any views and opinions, whilst given in good faith, are subject to change without notice.
This is not an official confirmation of terms and is not to be taken as advice to take any action in relation to any investment mentioned herein. Any prices or quotations contained herein are indicative only.
Kepler Partners LLP (including its partners, employees and representatives) or a connected person may have positions in or options on the securities detailed in this report, and may buy, sell or offer to purchase or sell such securities from time to time, but will at all times be subject to restrictions imposed by the firm's internal rules. A copy of the firm's conflict of interest policy is available on request.
Past performance is not necessarily a guide to the future. The value of investments can fall as well as rise and you may get back less than you invested when you decide to sell your investments. It is strongly recommended that Independent financial advice should be taken before entering into any financial transaction.
PLEASE SEE ALSO OUR TERMS AND CONDITIONS
Kepler Partners LLP is a limited liability partnership registered in England and Wales at 9/10 Savile Row, London W1S 3PF with registered number OC334771.
Kepler Partners LLP is authorised and regulated by the Financial Conduct Authority.