Stockwatch: which of these two rival UK shares should you be buying?
Analyst Edmond Jackson examines companies in a sector currently igniting investors’ interest.
14th August 2026 11:56
by Edmond Jackson from interactive investor

On 24 July, I examined FTSE 250 shares Galliford Try Holdings (LSE:GFRD) and Kier Group (LSE:KIE) for defensive growth amid successive governments touting infrastructure spending as a means to boost the economy.
After previously rating them “buy” for recovery a few years ago, I tempered to “hold” last September given UK economic uncertainty. Yet profit upgrades prompted me last month to re-rate them as a “buy” on a two- to three-year view, possibly favouring Kier for its relative discount to the sector.
- Our Services: SIPP Account | Stocks & Shares ISA | See all Investment Accounts
To appreciate the sector, it is relevant to consider this week’s updates from FTSE 250 Balfour Beatty (LSE:BBY) and Costain Group (LSE:COST) – both showing good underlying momentum albeit with share valuations possibly now in-line with the numbers.
The prospect of higher energy prices is good and bad: serving to differentiate infrastructure-related shares from others more directly affected, yet they are not immune from a higher inflation scenario working through to costs.
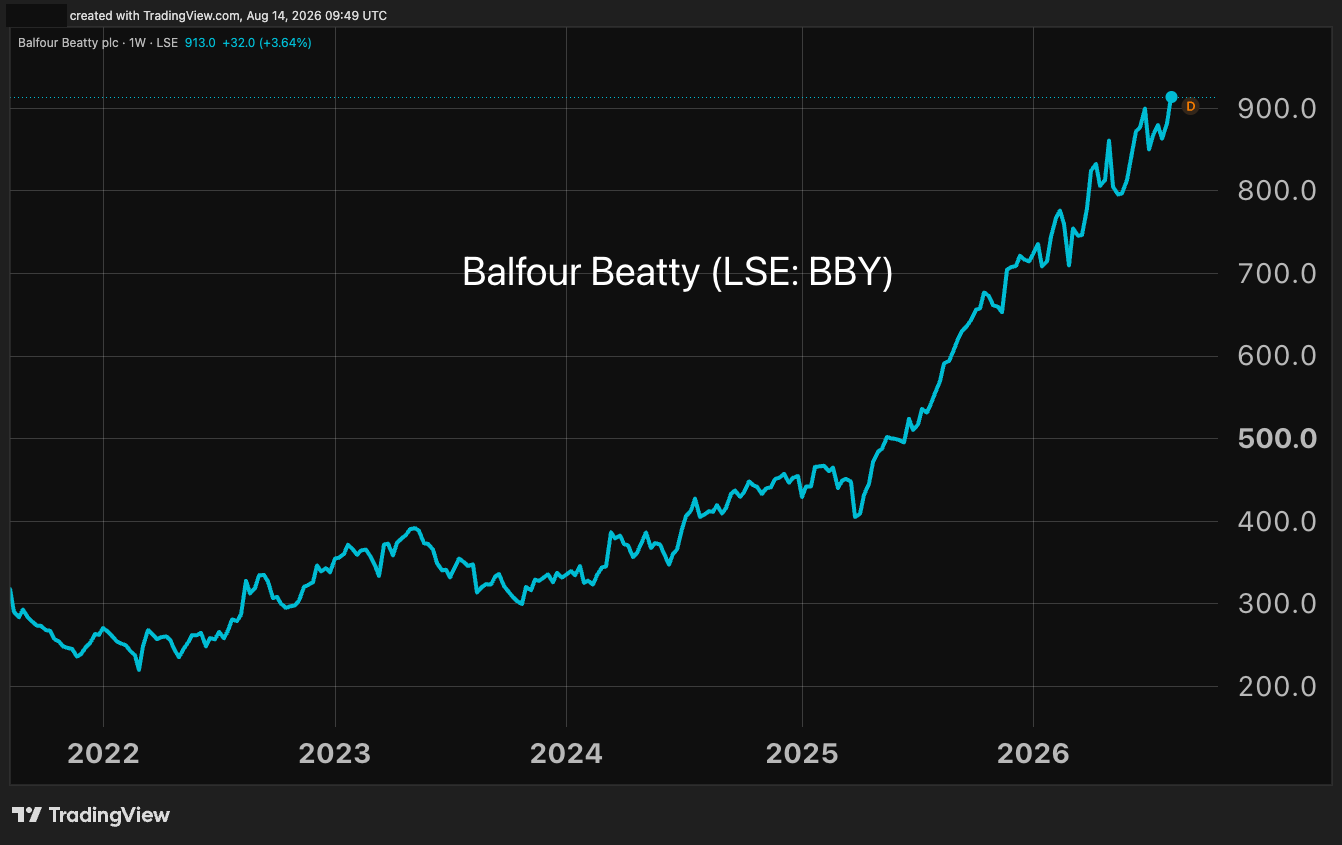
Balfour Beatty exemplifies how the stock market favours and continues to respond to the type of share that looks low-risk with strong revenue visibility and underlying momentum in robust markets.
I have missed its tripling in the last four years, inured by a sideways-volatile trend that persisted as far back as the 2008 crisis. Yet the chart has been similar to Galliford Try, and I did rate it “buy” at 97p equivalent from May 2018.
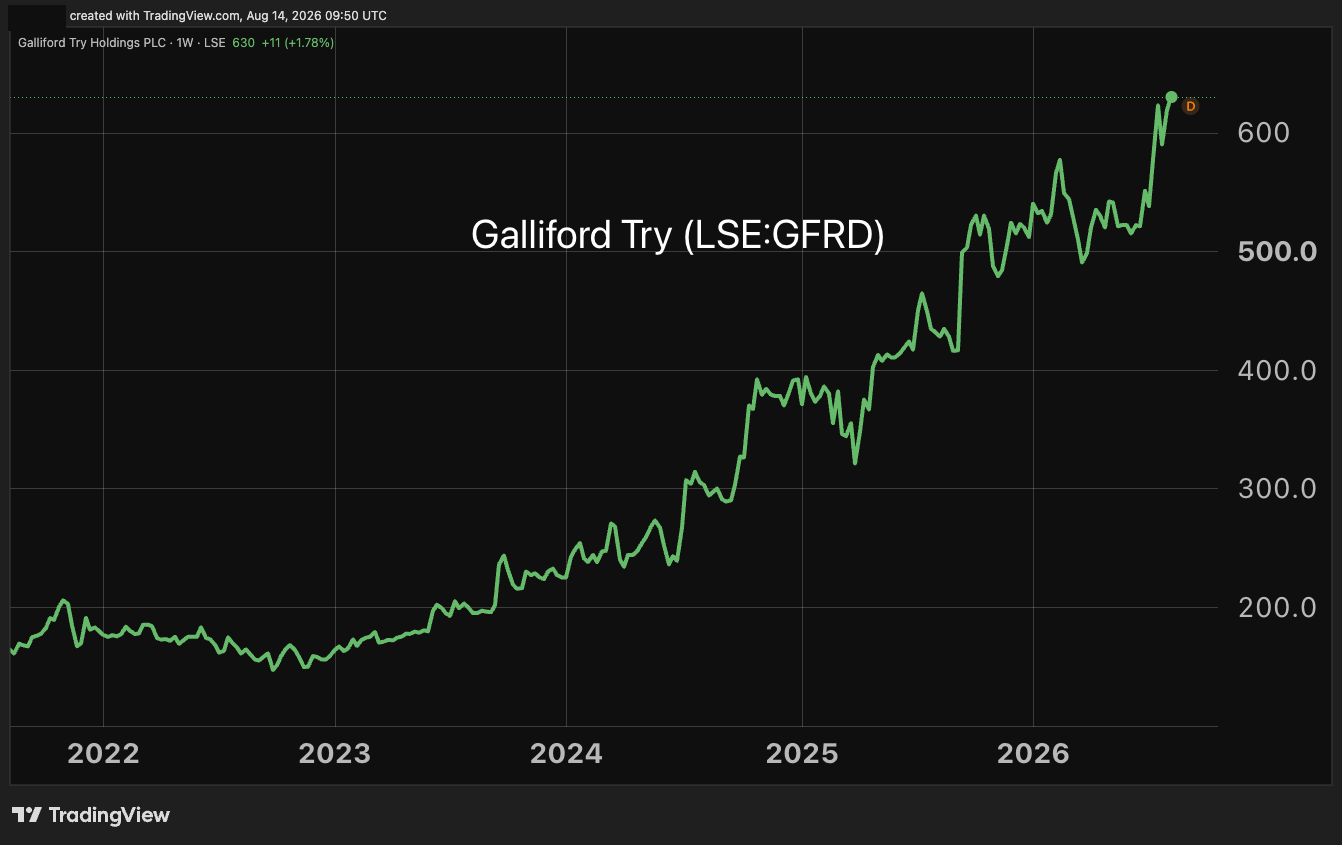
Source: TradingView. Past performance is not a guide to future performance.
Last Wednesday’s interims prompted the shares to settle up 7% at 923p, on a 2027 price/earnings (PE) over 16x according to consensus, albeit a prospective yield only of about 1.8% despite 3.4x expected cover. That is on the way to a “growth” type rating and a considerable sentiment shift from investors’ prior reading of contractor-type shares as fundamentally high risk and exposed to operational issues impacting already low margins. In due respect, various managements have made improvements to mitigate this.
- ii view: Balfour Beatty shares soar as it ups profit hopes
- Insider: major director purchases at a big discount
Balfour’s reported interim operating margin is 2.2% versus 3.0% last year, although management showcases operating profit from its “earnings-based businesses” (its direct operations) up 42% to 153 million and underlying interim earnings per share (EPS) up 51% to 21.7p.
This is encouraging in the sense that overall return on capital employed (a function significantly of margin) has averaged only 7% since 2020, but in 2025 re-rated from such a level to 10.7%, and could improve further.
Balfour Beatty - financial summary
Year-end 31 Dec
| 2020 | 2021 | 2022 | 2023 | 2024 | 2025 | |
| Turnover (£ million) | 7,318 | 7,202 | 7,629 | 7,993 | 8,234 | 9,489 |
| Operating margin (%) | 0.7 | 1.2 | 3.6 | 2.5 | 2.3 | 3.0 |
| Operating profit (£m) | 52.0 | 83.0 | 273 | 203 | 187 | 282 |
| Net profit (£m) | 30.0 | 140 | 288 | 197 | 178 | 263 |
| EPS - reported (p) | 4.4 | 21.1 | 46.5 | 34.8 | 33.7 | 52.1 |
| EPS - normalised (p) | 1.5 | 40.1 | 46.0 | 34.8 | 40.9 | 37.2 |
| Operating cashflow/share (p) | 39.7 | 53.2 | 27.1 | 50.4 | 50.2 | 130 |
| Capital expenditure/share (p) | 9.6 | 5.6 | 5.2 | 17.0 | 5.3 | 9.7 |
| Free cashflow/share (p) | 30.1 | 47.6 | 21.9 | 33.4 | 44.9 | 120 |
| Dividend/share (p) | 1.5 | 9.0 | 3.5 | 10.5 | 11.8 | 22.7 |
| Covered by earnings (x) | 2.9 | 2.3 | 13.3 | 13.3 | 3.3 | 2.9 |
| Return on total capital (%) | 2.1 | 3.4 | 11.4 | 8.0 | 7.1 | 10.7 |
| Cash (£m) | 792 | 1,033 | 1,179 | 1,414 | 1,558 | 1,860 |
| Net debt (£m) | -139 | -418 | -441 | -435 | -446 | -837 |
| Net assets (£m) | 1,336 | 1,369 | 1,378 | 1,198 | 1,121 | 1,143 |
| Net assets per share (p) | 194 | 198 | 234 | 220 | 217 | 232 |
Source: company accounts.
For context, Kier’s annual reported margin looks to be trending around 2.8% lately, with Galliford’s 2.3% and Costain’s 3.2% in its latest interims, hence a special premium in Balfour’s rating needs better justifying in terms of its numbers than narrative.
Significantly, behind the leap in interim profits is a turnaround in US construction from an £11 million equivalent loss to £22 million profit, although it is hard to guesstimate where US return on capital lies until a profitable track record settles. There has also been a 43% advance to £66 million on the support services side – chiefly energy, road and rail – driven by growth in UK power transmissions.
Infrastructure investment actually clocked a £9 million loss if slightly down on £10 million in the first half of 2025, due to “monitor and legal costs” but these have now ceased.
Looking forward, guidance for operating profit from the earnings-based businesses is raised from high single-digit growth to low double-digit growth in respect of full-year 2026. Average net cash has also risen from a £1.3-£1.5 billion range to a £1.5-1.7 billion range (or by 14% based on medians), although care is needed here as (prospective) clients may insist on a substantive cash buffer as part of contractual terms.
- FTSE 100 insurer Aviva’s results blow past estimates
- Shares the pros are backing for solid dividend growth
Balfour’s order book had climbed to £22.9 billion as of 30 June, only slightly up from £22.7 billion at the end of 2025, but there had been a jump from £19.5 billion in mid-2025 driven by US construction and UK power transmission enjoying structurally strong demand. Major UK energy and defence work is also yet to flow through the order book and there is a healthy pipeline of US projects.
So, there are superior growth prospects here compared with other, more cyclically-exposed shares should energy prices jump. This justifies a “hold” stance on Balfour, although given its PE and 2.9% prospective yield based on 2027 expectations although late to the party, I am less convinced of a “buy” rating given that operations are yet to fully shrug off classic contractor issues.
For example, in terms of profit adjustments, the interims include a £9 million provision for Building Safety Act claims versus £11 million in the first half of 2025, plus the release of a £50 million provision relating to a Texas road project completed in 2012 (Balfour’s share of the settlement was covered by insurers).
On a medium-term view, it will be interesting to see whether Balfour’s professed commercial momentum enables the shares to keep rising, or if my concerns about valuation lead to a consolidation phase.
A positive response also to Costain’s interim results
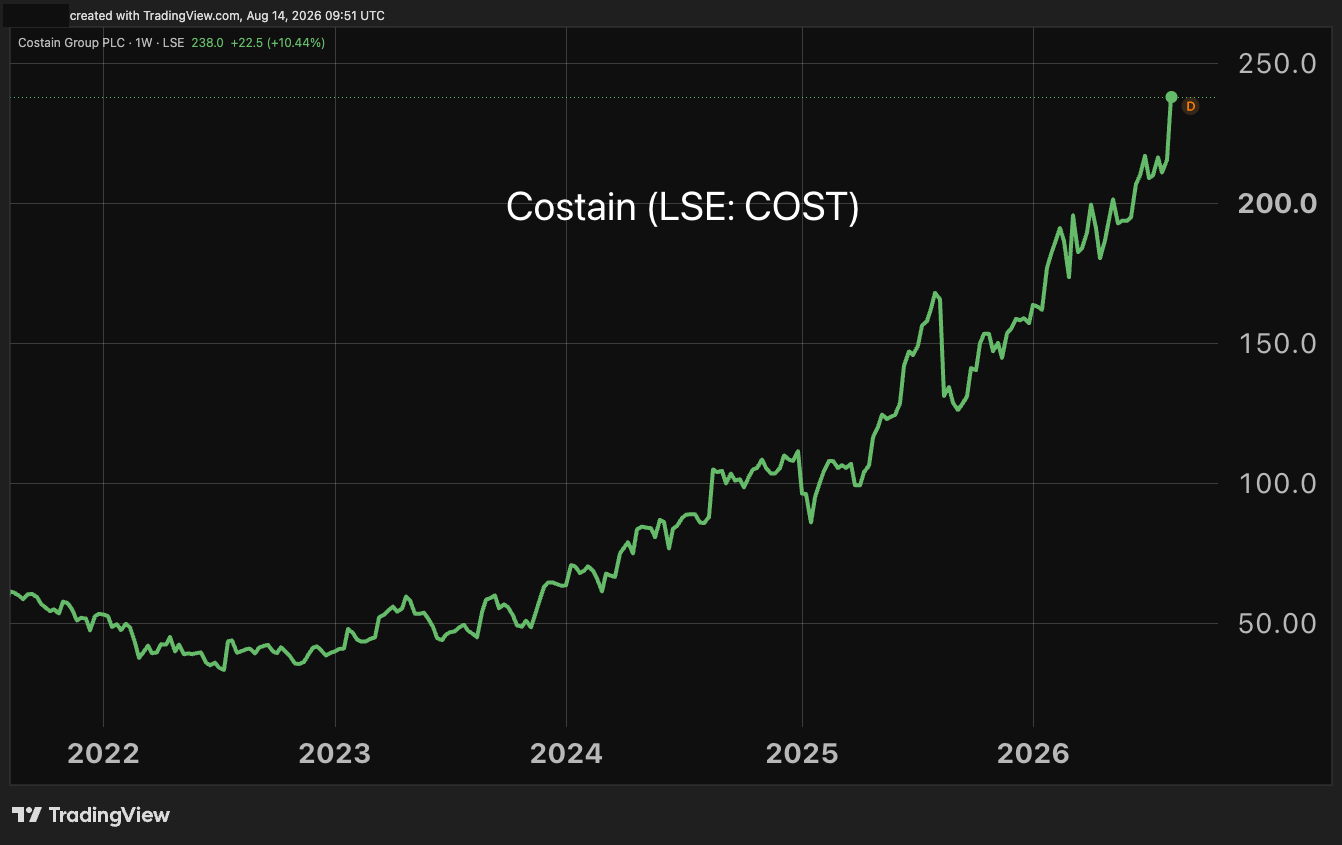
Its shares have trended similar to Balfour’s over the last four years as investors’ scepticism of contractors eased and Costain recovered well from the impact of Covid lockdowns:
Source: TradingView. Past performance is not a guide to future performance.
Perhaps showing how infrastructure is currently favoured, the shares rose 5% to 230p yesterday despite low single-digit momentum, with first-half 2026 revenue up 3.4% to £543 million and adjusted operating profit up 3.0% to £17.3 million, maintaining a 3.2% margin. This could be regarded as flat in inflation-adjusted terms.
More positively, a £7.0 billion forward work position is up 25% year-on-year and by 67% over six years, if flat on end-2025. Management still expects sequential revenue growth in the second half-year driven by water industry upgrades as these move from a design to a construction phase, expansion of work at Heathrow, and the M60 road project also entering construction.
A 4.9% rise in interim net profit compares with 8.0% to £40.3 million expected for the full year with only a near 2% rise in normalised EPS to 15p yet 16% growth is expected in 2027 as the various projects advance. On such a basis, the forward PE is 13.1x with a 2.8% yield.
Costain Group - financial summary
year end 31 Dec
| 2017 | 2018 | 2019 | 2020 | 2021 | 2022 | 2023 | 2024 | 2025 | |
| Turnover (£ million) | 1,684 | 1,464 | 1,156 | 978 | 1,135 | 1,421 | 1,332 | 1,251 | 1,046 |
| Operating margin (%) | 2.8 | 3.0 | -0.3 | -9.4 | -0.8 | 2.5 | 2.0 | 2.5 | 4.3 |
| Operating profit (£m) | 47.5 | 43.4 | -2.9 | -91.8 | -9.5 | 34.9 | 26.8 | 31.1 | 44.4 |
| Net profit (£m) | 33 | 33 | -2.9 | -78.0 | -5.8 | 25.9 | 22.1 | 30.6 | 37.3 |
| Reported EPS (p) | 27.1 | 26.8 | -2.4 | -36.7 | -2.1 | 9.4 | 7.8 | 11.1 | 13.7 |
| Normalised EPS (p) | 27.1 | 35.2 | 16.1 | -31.2 | -2.1 | 9.8 | 13.2 | 16.6 | 14.7 |
| Operating cashflow/share (p) | 42.8 | -39.2 | -26.5 | -22.1 | 10.7 | 5.1 | 19.7 | 15.5 | 19 |
| Capex/share (p) | 1.7 | 1.1 | 5.7 | 1.9 | 0.8 | 0.2 | 0.0 | 3.3 | 1.0 |
| Free cashflow/share (p) | 41.1 | -40.3 | -32.2 | -24.0 | 9.9 | 4.9 | 19.7 | 12.2 | 17.8 |
| Ordinary dividend per share (p) | 12.4 | 13.4 | 3.4 | 0.0 | 0.0 | 0.0 | 1.2 | 2.4 | 4.2 |
| Covered by earnings (x) | 2.2 | 2.0 | -0.7 | 0.0 | 0.0 | 0.0 | 6.5 | 4.6 | 3.3 |
| Return on total capital (%) | 19.8 | 17.5 | -1.3 | -41.1 | -3.8 | 14.9 | 11.4 | 12.4 | 16.1 |
| Cash (£m) | 249 | 189 | 181 | 151 | 159 | 124 | 164 | 159 | 189 |
| Net debt (£m) | -178 | -119 | -34.9 | -70.8 | -93.2 | -94.3 | -140 | -133 | -164 |
| Net assets/share (p) | 129 | 151 | 129 | 56.9 | 72.4 | 76.8 | 79.3 | 87.7 | 96.8 |
Source: historic company REFS and company accounts.
Re-rates both of Balfour and Costain are effectively multi-year mean reversions that look broadly complete, the key question being to what extent the macro context can support earnings growth.
On 24 July, I suggested the Burnham government could be instrumental, but in terms of buying pay more attention to value. Hence, at 240p Kier looked attractive on a forward PE of 10 while offering 13% potential EPS growth this latest fiscal year to 30 June. While expected to ease to 7% to June 2027, such guidance might have left scope for upgrades. The shares have risen to 260p as investors perceive value.
- 5 smart steps to navigate pre-Budget uncertainty
- Sign up to our free newsletter for investment ideas, latest news and award-winning analysis
On 27 January, I did reiterate “buy” for Costain at 174p, having originally done so a year previously at 96p on an apparent forward PE of 7x and with buybacks manifesting. The 10 March prelims showed the 2025 group operating margin rising to 4.25% from 2.5% aiding return on capital employed up to 16.1% from 12.4%.
That is just over 50% better than Balfour’s 10.7% rate although Costain is much the smaller company – less than 14% of Balfour’s size, as measured by market capitalisation, hence it can perhaps focus better.
It is a close call according to how overall UK macro pans out, but I retain “buy” on Costain. Try to exploit market volatility if and when you do buy.
Edmond Jackson is a freelance contributor and not a direct employee of interactive investor.
These articles are provided for information purposes only. Occasionally, an opinion about whether to buy or sell a specific investment may be provided by third parties. The content is not intended to be a personal recommendation to buy or sell any financial instrument or product, or to adopt any investment strategy as it is not provided based on an assessment of your investing knowledge and experience, your financial situation or your investment objectives. The value of your investments, and the income derived from them, may go down as well as up. You may not get back all the money that you invest. The investments referred to in this article may not be suitable for all investors, and if in doubt, an investor should seek advice from a qualified investment adviser.
Full performance can be found on the company or index summary page on the interactive investor website. Simply click on the company's or index name highlighted in the article.
Disclosure
We use a combination of fundamental and technical analysis in forming our view as to the valuation and prospects of an investment. Where relevant we have set out those particular matters we think are important in the above article, but further detail can be found here.
Please note that our article on this investment should not be considered to be a regular publication.
Details of all recommendations issued by ii during the previous 12-month period can be found here.
ii adheres to a strict code of conduct. Contributors may hold shares or have other interests in companies included in these portfolios, which could create a conflict of interests. Contributors intending to write about any financial instruments in which they have an interest are required to disclose such interest to ii and in the article itself. ii will at all times consider whether such interest impairs the objectivity of the recommendation.
In addition, individuals involved in the production of investment articles are subject to a personal account dealing restriction, which prevents them from placing a transaction in the specified instrument(s) for a period before and for five working days after such publication. This is to avoid personal interests conflicting with the interests of the recipients of those investment articles.