How the AI rally transformed emerging market equities
A Kepler analyst highlights some investment trusts that provide diversification away from AI and towards developing economies.
28th August 2026 13:17
This content is provided by Kepler Trust Intelligence, an investment trust focused website for private and professional investors. Kepler Trust Intelligence is a third-party supplier and not part of interactive investor. It is provided for information only and does not constitute a personal recommendation.
Material produced by Kepler Trust Intelligence should be considered a marketing communication, and is not independent research.
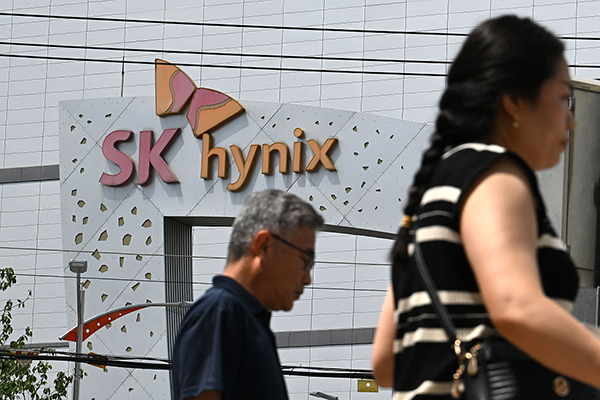
Pedestrians walk past memory-chip manufacturer SK Hynix’s headquarters in Icheon, South Korea. Photo: Jung Yeon-je/AFP via Getty Images.
Edmond Dantès, the main protagonist of The Count of Monte Cristo, is unjustly convicted and locked away in a prison on an island off the coast of Marseille, forgotten by everyone he knew. Years later, he reappears on the mainland as a mysterious and immensely wealthy count, determined to take revenge on the men who conspired to have him arrested.
This may be loosely compared to emerging market equities, which had flown under the radar since 2021. This is because investors’ attention had been particularly focused on the US, which has been the epicentre of the AI rally triggered by the launch of OpenAI’s ChatGPT in late November 2022, while China, an important component of the emerging markets universe, faced a severe real estate crisis.
Since early 2025, however, emerging market equities have come back with a vengeance, outperforming their developed market peers. A key driver has been the build-out of AI infrastructure, as many emerging market companies, particularly in Taiwan and South Korea, supply essential hardware for it. This includes, for example, memory chips, a market in which two of the three largest players are from South Korea: SK hynix Inc ADR (NASDAQ:SKHY) and Samsung Electronics Co Ltd DR (LSE:SMSN).
Meanwhile, Taiwan is home to the world’s largest chip foundry, Taiwan Semiconductor Manufacturing Co Ltd ADR (NYSE:TSM), as well as to many other businesses that play a critical role in the AI hardware supply chain like Delta Electronics (Thailand) PCL SGDR (SGX:TDED), a manufacturer of power units.
Performance since start of 2025
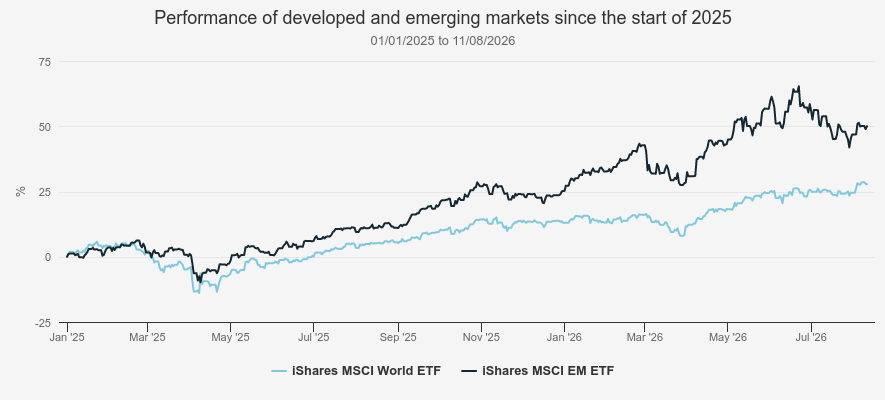
Source: Morningstar. Past performance is not a reliable indicator of future results
Yet, an outcome of the strong performance of these hardware-related companies is that emerging market indices have now become heavily concentrated in the AI theme. As a result, the dilemma facing investors concerned about a possible bubble in AI-related stocks also applies to emerging market equities, and diversifying into emerging markets will do nothing to lessen exposure to any bubble.
In addition, shifts in country weights have led Taiwan and South Korea to together account for nearly half the index. Given that both are high-income countries, we believe emerging market equity indices do not offer as much exposure to what might be considered true developing economies as many investors may wish.
Concentrated index
While not every company in the information technology sector is involved in the AI supply chain, most AI-related businesses tend to fall within it. As such, we believe it is reasonable to use the weight of this sector in an index as a proxy for its exposure to AI.
Following the rally in hardware-related companies, the weight of this sector in standard emerging market equity indices is now particularly elevated. For example, it accounted for 40.8% of the MSCI EM at the end of July 2026. To put this figure into perspective, the information technology sector made up only 28.9% of the MSCI World. In addition, nine of the 10 largest constituents of the MSCI EM are AI-related companies, including Taiwanese and South Korean hardware suppliers as well as some Chinese hyperscalers, such as Tencent Holdings Ltd (SEHK:700) and Alibaba Group Holding Ltd ADR (NYSE:BABA).
Moreover, we think emerging market equity indices do not offer strong diversification within the AI theme either. For instance, a single stock, TSMC, accounts for 15.5% of the MSCI EM, well above NVIDIA Corp (NASDAQ:NVDA)’s 5% weight in the MSCI World.
Such a significant weight means that TSMC will have a substantial impact on the performance of the index. Furthermore, hardware-related companies account for the vast majority of the MSCI EM’s 10 largest constituents, while the combined weight of the two Chinese hyperscalers is only around one-third of TSMC’s.
As such, we believe that emerging market equity indices are likely to be particularly sensitive not only to the AI theme in general, but specifically to capital expenditure on AI infrastructure.
Top 10 constituents of MSCI EM
| Constituent | Country | Sector | Industry | Weight (%) |
| Taiwan Semiconductor Manufacturing Co Ltd ADR (NYSE:TSM) | Taiwan | Information technology | Semiconductors | 15.5 |
| Samsung Electronics Co Ltd DR (LSE:SMSN) | South Korea | Information technology | Consumer electronics | 7.2 |
| SK hynix Inc ADR (NASDAQ:SKHY) | South Korea | Information technology | Semiconductors | 5.6 |
| Tencent Holdings Ltd (SEHK:700) | China | Communication services | Internet content & information | 3.1 |
| Alibaba Group Holding Ltd ADR (NYSE:BABA) | China | Consumer discretionary | Internet retail | 2.1 |
| Mediatek | Taiwan | Information technology | Semiconductors | 1.3 |
| Samsung Electronics preference shares | South Korea | Information technology | Consumer electronics | 0.9 |
| Delta Electronics (Thailand) PCL SGDR (SGX:TDED) | Taiwan | Information technology | Electronic components | 0.8 |
| China Construction Bank Corp Class H (SEHK:939) | China | Financials | Banks - diversified | 0.8 |
| Hon Hai Precision Industry Co Ltd DR (LSE:HHPD) | Taiwan | Information technology | Electronic components | 0.8 |
| Total | 38.1 | |||
Source: MSCI as at 31/07/2026.
We note that several managers of investment trusts in the Association of Investment Companies (AIC) Global Emerging Markets sector have taken steps to address these concentration risks.
For example, despite remaining constructive on their AI-related holdings, the managers of Templeton Emerging Mkts Invmt Tr TEMIT (LSE:TEM), Chetan Sehgal and Andrew Ness, have trimmed their positions in these names and redeployed capital elsewhere in the market as part of their risk-management process.
Meanwhile, Omar Neygal, manager of JPMorgan Emerging Markets Div Inc (LSE:JEMI), has shifted to an underweight position in the information technology sector after trimming his AI-related holdings in particular, which he currently views as highly valued and more susceptible to volatility.
The rise of developed economies
For many investors, the rationale for investing in emerging markets is often to gain exposure to developing economies, in the hope that their faster GDP growth will translate into stronger returns. However, following the rally in Taiwanese and South Korean hardware-related stocks, the combined weight of these two countries in emerging market equity indices has increased. For example, they now collectively account for c. 47% of the MSCI EM, with Taiwan now representing the index’s largest country weight.
Although Taiwan and South Korea are still categorised as ‘emerging’ by index providers such as MSCI and FTSE due to capital market criteria (e.g. market accessibility, regulations, or trading infrastructure), they are fully developed countries in economic terms. For instance, the World Bank considers them both high-income countries, while the International Monetary Fund (IMF) categorises them as advanced economies.
In the table below, we show how South Korea (for which more data is available) compares on key economic and development measures with the UK and the three largest economies in the OECD: the US, Germany, and Japan. We note that, on many of these measures, South Korea scores close to or even higher than Japan, which is categorised as a developed equity market. Therefore, we believe that standard emerging market equity indices do not provide pure exposure to developing economies.
Economic measures
| South Korea | UK | US | Germany | Japan | |
| Grossdomestic product – 2025 (in $trn) | 1.9 | 4 | 30.8 | 5.1 | 4.4 |
| Grossdomestic product per capita -2025 (in $) | 36,227 | 57,602 | 90,027 | 60,496 | 35,951 |
| Gross national income per capita – 2025 (in $) | 37,880 | 54,550 | 88,810 | 60,200 | 38,340 |
| Human development index score - 2025 | 0.937 | 0.946 | 0.938 | 0.959 | 0.925 |
Source: World Bank, United Nations.
In terms of GDP growth, data from the IMF suggests that Taiwan and South Korea will experience stronger growth than their advanced economy peers until at least 2030. However, the IMF’s ‘emerging market and developing economies’ category is expected to see even faster GDP growth over that period. The exception is 2026, with Taiwan expected to record real GDP growth of above 5%, higher than the average for both advanced and developing economies. This is strongly related to AI capital expenditure, but Taiwan’s GDP growth is forecast to stabilise below 3% in subsequent years, as the chart below shows.
Real GDP growth
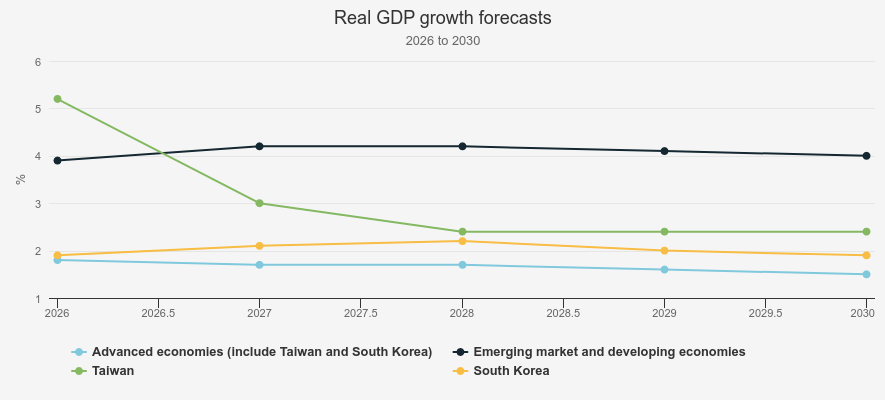
Source: IMF.
In our view, some investment trusts in the AIC Global Emerging Markets sector benefit from mandates enabling them to better capture the growth potential of developing economies than standard emerging market equity indices, while also having very little exposure to the AI trade. These include, for example, BlackRock Frontiers Ord (LSE:BRFI), which focuses on smaller emerging markets such as the UAE and Indonesia, as well as frontier markets like Kazakhstan and Kenya. These countries are experiencing rapid GDP growth and tend to be less correlated with global equities, as their markets are typically driven by domestic investors, endogenous reforms, and local economic fundamentals.
Barings Emerging EMEA Opportunities Ord (LSE:BEMO)also offers a distinctive approach to emerging markets, as it invests in specific regions, namely Emerging Europe, the Middle East, and Africa (EMEA). These regions are typically under-researched and underrepresented in emerging market equity indices but offer exposure to drivers distinct from those of Asian emerging markets. These include, among others, domestic reforms, regional political developments, or commodity cycles.
Meanwhile, many of the countries in the EMEA region are still developing economies. For example, BEMO’s five largest country weights (South Africa, Saudi Arabia, the UAE, Poland, and Turkey) are all categorised as ‘emerging and developing economies’ by the IMF. Finally, we note that BEMO trades at an 11% discount, one of the largest in the AIC Global Emerging Markets sector, as the chart below shows.
Discount*
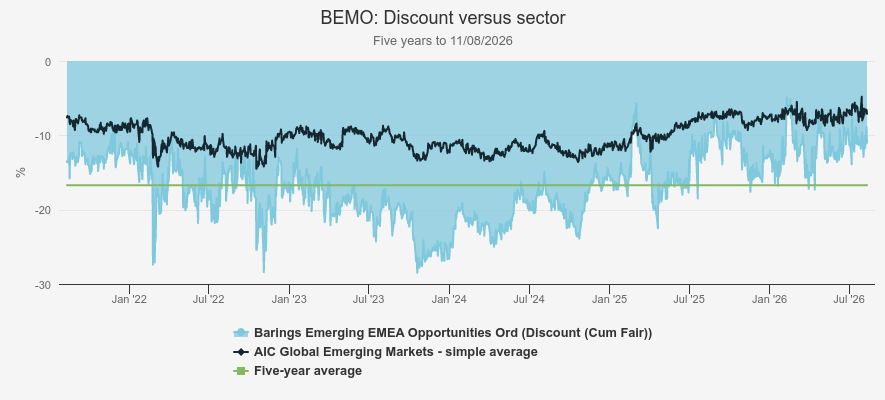
Source: Morningstar *Note that we have excluded JPMorgan Emerging Europe, Middle East & Africa (JEMA) from our calculations of the sector simple average, as it trades on a significantly high premium of 242.3% due to uncertainty over the value of its Russian assets.
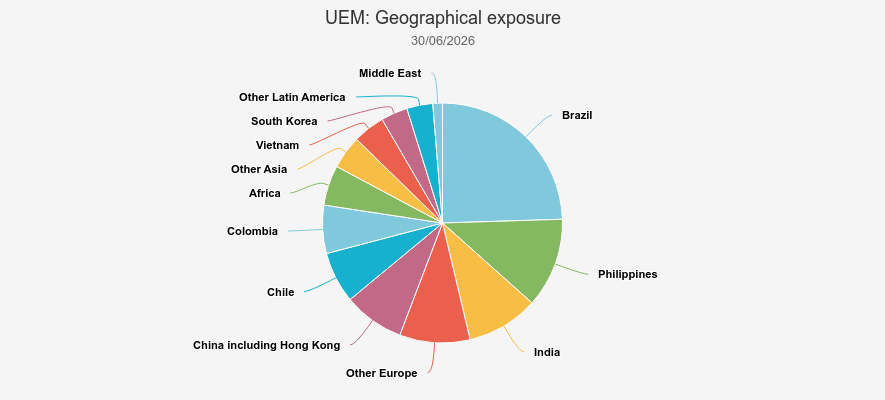
Another example is Utilico Emerging Markets Ord (LSE:UEM), which focuses on infrastructure and utilities. It has a very distinctive mandate compared with many emerging market equity strategies, enabling investors to gain exposure to long-term themes typically associated with developing economies, such as urbanisation, demographic growth, and the rise of the middle class. As the chart below shows, UEM has limited exposure to Taiwan and South Korea, but greater exposure to true developing economies such as Brazil, India, and Southeast Asian countries like the Philippines.
Geographical exposure
Source: ICM.
Conclusion
In our view, the rise of companies such as TSMC, SK Hynix, Samsung Electronics, and other key hardware suppliers is testament to the success of emerging markets in developing world-class companies with few peers elsewhere in the world.
However, their current dominance of standard emerging market indices creates a significant concentration risk around the AI theme. Moreover, this also means that these indices do not offer meaningful diversification benefits relative to developed market indices, which are also dominated by AI-related stocks, as discussed in a previous article. In addition, developed economies now account for approximately half of emerging market equity indices, which, we believe, is not what many investors are looking for when allocating capital to this asset class.
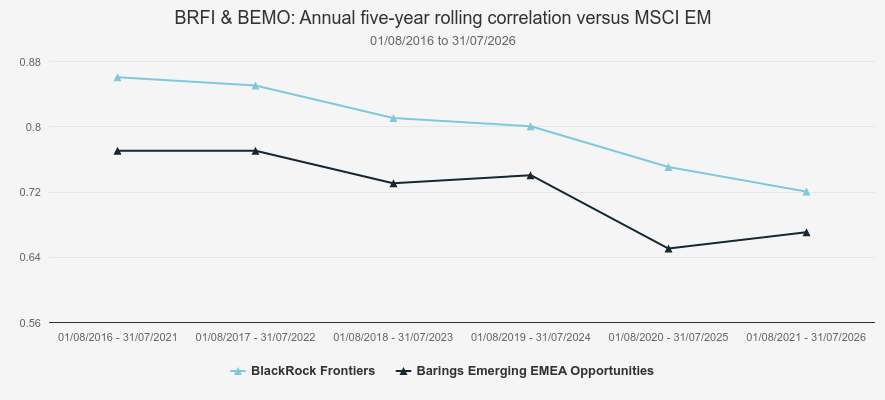
As such, we think trusts like BRFI and BEMO could be strong complements to core emerging market equity strategies, as they provide diversification away from AI and developed economies. Neither has exposure to Taiwanese and South Korean hardware suppliers or Chinese hyperscalers, offering instead exposure to distinct drivers of return. They also have greater exposure to developing economies, which, in our view, better aligns them with many investors’ conception of emerging markets.
Furthermore, the correlation of the two trusts with the MSCI EM has progressively declined over the past 10 years, as the chart below shows. We see this as a reflection of the growing weight of AI-related companies in emerging market equity indices.
Correlation
Source: Morningstar.
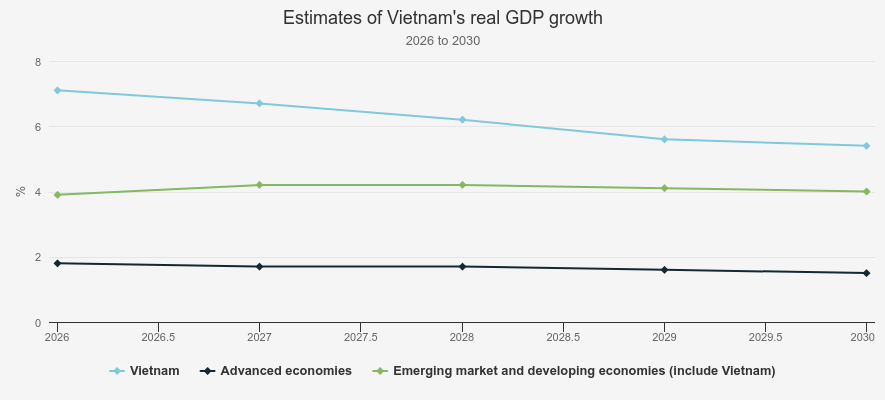
Finally, we believe that Vietnam Enterprise Ord (LSE:VEIL)could be an attractive option for investors looking to invest in a ‘pure’ emerging market. Vietnam is a rapidly growing developing economy (see chart below), and VEIL aims to capture this economic boom through a portfolio structured around domestic themes such as banking, infrastructure, and consumption.
It is also a country that emerging market investors are typically not exposed to, as it has historically been classified as a frontier market by major index providers. While FTSE has recently upgraded it to ‘secondary emerging market’ status (effective in mid-September 2026), MSCI still categorises it as a frontier market. In addition, the trust is currently trading at a 12.1% discount, offering re-rating potential.
Source: IMF.
Kepler Partners is a third-party supplier and not part of interactive investor. Neither Kepler Partners or interactive investor will be responsible for any losses that may be incurred as a result of a trading idea.
These articles are provided for information purposes only. Occasionally, an opinion about whether to buy or sell a specific investment may be provided by third parties. The content is not intended to be a personal recommendation to buy or sell any financial instrument or product, or to adopt any investment strategy as it is not provided based on an assessment of your investing knowledge and experience, your financial situation or your investment objectives. The value of your investments, and the income derived from them, may go down as well as up. You may not get back all the money that you invest. The investments referred to in this article may not be suitable for all investors, and if in doubt, an investor should seek advice from a qualified investment adviser.
Full performance can be found on the company or index summary page on the interactive investor website. Simply click on the company's or index name highlighted in the article.
Important Information
Kepler Partners is not authorised to make recommendations to Retail Clients. This report is based on factual information only, and is solely for information purposes only and any views contained in it must not be construed as investment or tax advice or a recommendation to buy, sell or take any action in relation to any investment.
This report has been issued by Kepler Partners LLP solely for information purposes only and the views contained in it must not be construed as investment or tax advice or a recommendation to buy, sell or take any action in relation to any investment. If you are unclear about any of the information on this website or its suitability for you, please contact your financial or tax adviser, or an independent financial or tax adviser before making any investment or financial decisions.
The information provided on this website is not intended for distribution to, or use by, any person or entity in any jurisdiction or country where such distribution or use would be contrary to law or regulation or which would subject Kepler Partners LLP to any registration requirement within such jurisdiction or country. Persons who access this information are required to inform themselves and to comply with any such restrictions. In particular, this website is exclusively for non-US Persons. The information in this website is not for distribution to and does not constitute an offer to sell or the solicitation of any offer to buy any securities in the United States of America to or for the benefit of US Persons.
This is a marketing document, should be considered non-independent research and is subject to the rules in COBS 12.3 relating to such research. It has not been prepared in accordance with legal requirements designed to promote the independence of investment research.
No representation or warranty, express or implied, is given by any person as to the accuracy or completeness of the information and no responsibility or liability is accepted for the accuracy or sufficiency of any of the information, for any errors, omissions or misstatements, negligent or otherwise. Any views and opinions, whilst given in good faith, are subject to change without notice.
This is not an official confirmation of terms and is not to be taken as advice to take any action in relation to any investment mentioned herein. Any prices or quotations contained herein are indicative only.
Kepler Partners LLP (including its partners, employees and representatives) or a connected person may have positions in or options on the securities detailed in this report, and may buy, sell or offer to purchase or sell such securities from time to time, but will at all times be subject to restrictions imposed by the firm's internal rules. A copy of the firm's conflict of interest policy is available on request.
Past performance is not necessarily a guide to the future. The value of investments can fall as well as rise and you may get back less than you invested when you decide to sell your investments. It is strongly recommended that Independent financial advice should be taken before entering into any financial transaction.
PLEASE SEE ALSO OUR TERMS AND CONDITIONS
Kepler Partners LLP is a limited liability partnership registered in England and Wales at 9/10 Savile Row, London W1S 3PF with registered number OC334771.
Kepler Partners LLP is authorised and regulated by the Financial Conduct Authority.