Only one fund clears this consistency test
Saltydog Investor’s consistency test divides the last three years into six consecutive six-month periods. It then looks for funds that have risen by at least 5% in each one.
16th November 2026 14:21
by Douglas Chadwick from ii contributor

This content is provided by Saltydog Investor. It is a third-party supplier and not part of interactive investor. It is provided for information only and does not constitute a personal recommendation.
There are several ways to assess how well a fund has performed.
Looking at its return over three years is a useful starting point, but that figure alone tells us relatively little about how it got there.
A fund might have made much of its gain during one exceptional spell, with less rewarding periods either side. Another might have delivered a more modest overall return, but made steadier progress along the way.
- Invest with ii: SIPP Account | Stocks & Shares ISA | See all Investment Accounts
At Saltydog Investor, much of our weekly analysis concentrates on shorter-term trends. We monitor the Investment Association (IA) sectors and the individual funds in them, typically focusing on their performance over the last four, 12 and 26 weeks.
However, every three months, we also take a longer view through our 6 × 6 report.
For this analysis, we divide the last three years into six consecutive six-month periods. We then look for funds that have risen by at least 5% in each one. It is a demanding test.
In May’s report, no funds reached the target in all six periods, although 21 achieved it five out of six times.
By August, 17 funds qualified in all six periods. They covered a wide range of sectors, including four from Japan, three from Technology & Technology Innovation, and two from Financials & Financial Innovation. Other sectors represented included Global, Global Equity Income, North America, UK All Companies, UK Equity Income, and Mixed Investment 20–60% Shares.
Our latest report covers November 2023 to October 2026. This time, just one fund has achieved the elusive six out of six: Fidelity Global Dividend W Acc (B7GJPN7). Another 75 funds reached the target in five of the six periods.
However, the August and November reports use different six-month measurement periods, with all six windows shifted by three months. The comparison with May is more direct, because five of the six periods are unchanged.
The table below shows Fidelity Global Dividend, followed by the five funds that came closest to joining it, ranked by their return in the one period when they fell short.
| Saltydog Investor 6x6 Report - November 2026 | Nov 23 | May 24 | Nov 24 | May 25 | Nov 25 | May 26 | 1 year | 2 year | 3 year |
| to | to | to | to | to | to | return | return | return | |
| Apr 24 | Oct 24 | Apr 25 | Oct 25 | Apr 26 | Oct 26 | ||||
| Funds that have risen by 5% or more in all six periods | |||||||||
| Fidelity Global Dividend | 11.4% | 8.4% | 5.5% | 7.8% | 6.6% | 6.8% | 14% | 30% | 56% |
| Funds that have risen by 5% or more in five out of six periods | |||||||||
| Fidelity Special Situations | 17.5% | 6.6% | 5.1% | 17.2% | 4.4% | 13.4% | 18% | 46% | 83% |
| Vanguard FTSE UK Equity Income Index | 15.6% | 4.2% | 7.3% | 18.6% | 13.9% | 7.8% | 23% | 56% | 88% |
| Artemis Global Income | 23.5% | 6.3% | 11.7% | 30.1% | 17.8% | 4.0% | 23% | 78% | 134% |
| BNY Mellon UK Opportunities | 12.0% | 3.6% | 7.4% | 19.4% | 6.3% | 6.0% | 13% | 45% | 68% |
| Jupiter Financial Opportunities | 17.2% | 8.1% | 5.4% | 23.6% | 5.2% | 3.5% | 9% | 42% | 80% |
Data source: Morningstar. Past performance is not a guide to future performance.
Fidelity Global Dividend has been managed by Daniel Roberts since launch in January 2012, with Tristan Purcell joining as co-manager in December 2025.
The managers look for businesses capable of sustaining and growing their dividends, supported by dependable cash flows and strong balance sheets. Valuation also matters: a good business still needs to be available at an attractive price.
The fund aims to combine capital growth with lower volatility than the MSCI All Country World Index, alongside an income higher than that generated by the index’s constituent companies.
Its holdings provide a useful illustration of the approach. At the end of September, they included Unilever (LSE:ULVR), pharmaceutical companies Roche Holding AG Ordinary Shares new (SIX:ROP) and Novartis AG Registered Shares (SIX:NOVN), infrastructure group Vinci SA (EURONEXT:DG), and Deutsche Boerse AG (XETRA:DB1) and CME Group Inc Class A (NASDAQ:CME), which operate some of the world’s major financial exchanges. It also held semiconductor company Texas Instruments Inc (NASDAQ:TXN), but none of the major US technology companies NVIDIA Corp (NASDAQ:NVDA), Apple Inc (NASDAQ:AAPL), Microsoft Corp (NASDAQ:MSFT), Alphabet Inc Class A (NASDAQ:GOOGL), Amazon.com Inc (NASDAQ:AMZN) or Meta Platforms Inc Class A (NASDAQ:META).
That gives it a different mix from many global portfolios, particularly those heavily exposed to the largest US technology shares.
The following graph shows its performance over the three years covered by our report.
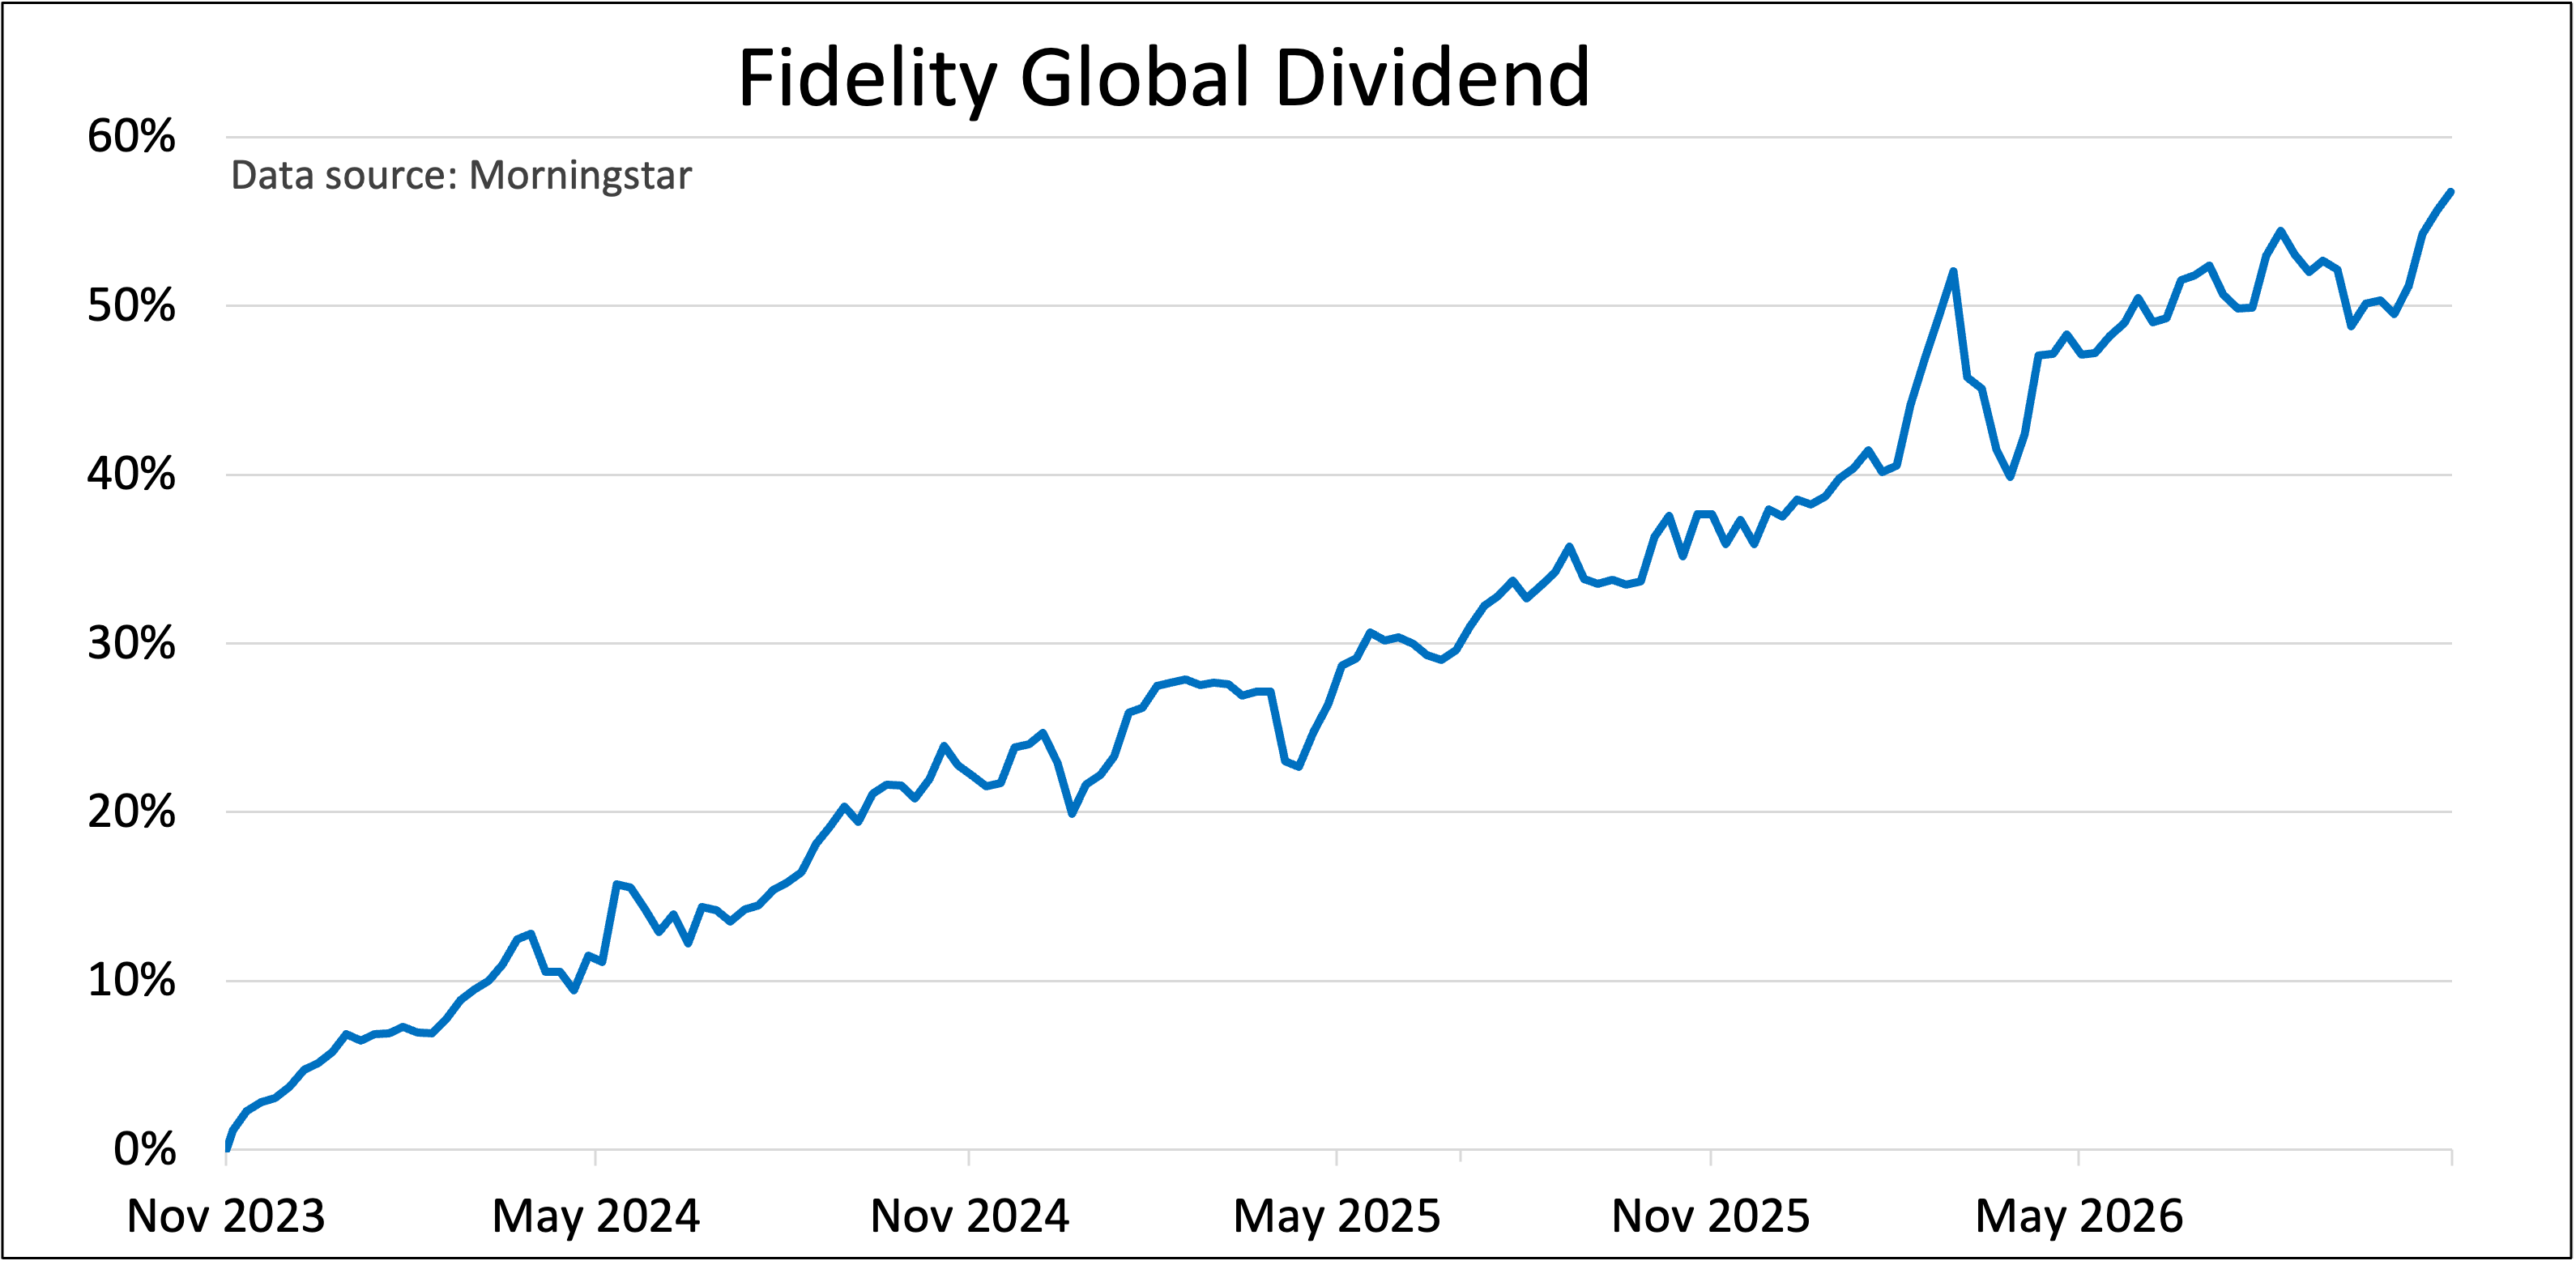
Data source: Morningstar. Past performance is not a guide to future performance.
The graph shows that progress hasn’t been uninterrupted. The fund fell by around 8% between the end of February and late March 2026, before recovering. Even a fund that clears all six of our hurdles can experience significant setbacks within those periods.
Among the closest challengers, Fidelity Special Situations W Acc (B88V3X4) missed the target only in the six months from November 2025 to April 2026. It gained 4.4%, falling short by just 0.6 percentage points. Over the full three years, it returned 82.8%.
Vanguard FTSE UK Eq Inc Idx £ Inc (B5B7468) was next. Its weakest period produced a gain of 4.2%, while its three-year return was 88.2%.
Artemis Global Income I Inc (B5N9956) provides perhaps the clearest example of the distinction between cumulative returns and consistency against our target. It gained 133.7% over three years, comfortably more than Fidelity Global Dividend. However, its return over the latest six months was 4.0%, missing the 5% target.
BNY Mellon UK Opports Resp Inst W Inc (B7RLX83) and Jupiter Financial Opportunities I Inc (B8JYV94) complete the table. Their weakest six-month returns were 3.6% and 3.5% respectively.
All six funds shown made gains in every period, even where they missed the 5% target.
The report doesn’t tell us which fund will perform best next, and passing the test doesn’t make a fund immune to losses. It does, however, add another perspective to the usual performance tables.
For investors looking beyond the largest headline returns, understanding how consistently a fund has made headway is also worth considering.
For more information about Saltydog, or to take the two-month free trial, go to www.saltydoginvestor.com
These articles are provided for information purposes only. Occasionally, an opinion about whether to buy or sell a specific investment may be provided by third parties. The content is not intended to be a personal recommendation to buy or sell any financial instrument or product, or to adopt any investment strategy as it is not provided based on an assessment of your investing knowledge and experience, your financial situation or your investment objectives. The value of your investments, and the income derived from them, may go down as well as up. You may not get back all the money that you invest. The investments referred to in this article may not be suitable for all investors, and if in doubt, an investor should seek advice from a qualified investment adviser.
Full performance can be found on the company or index summary page on the interactive investor website. Simply click on the company's or index name highlighted in the article.