Stockwatch: I’d still buy this share despite looming board battle
Sitting on a profit after successfully calling the bottom of the market, analyst Edmond Jackson believes this British company is still undervalued.
29th September 2026 10:13
by Edmond Jackson from interactive investor

I engaged the premium wallpaper, fabrics and paints group Sanderson Design Group Ordinary Shares (LSE:SDG) as a “buy” at 48p in January 2025 and again at 61.5p last February, liking its asset-backed turnaround with quality brands. Net tangible asset value was 0.6x and the market value was less than the £42.5 million it paid for just one business, Clarke & Clarke, in 2016.
- Our Services: SIPP Account | Stocks & Shares ISA | See all Investment Accounts
It turned out that a £16 million non-cash impairment became required for Clarke & Clarke, albeit well “in the price”. The CEO since 2019 had appeared to struggle somewhat in the sense that operating profit in 2022 post the Covid disruption levelled at around £10 million but then slid into a £14.4 million operating loss for the financial year ended January 2025. That was due to a weak UK market alongside the impairment. A weak housing market and stretched household budgets impacted UK brand product sales by 9%, and the business had to absorb cost inflation. Might we be about to see a repeat of this as Labour prepares to raise taxes?
Such a reading would explain why the shares recovered to test 80p last August – still below 82.3p net tangible assets per share on the 31 January balance sheet – but slipped in September as concerns grew about the 28 October Autumn Budget.
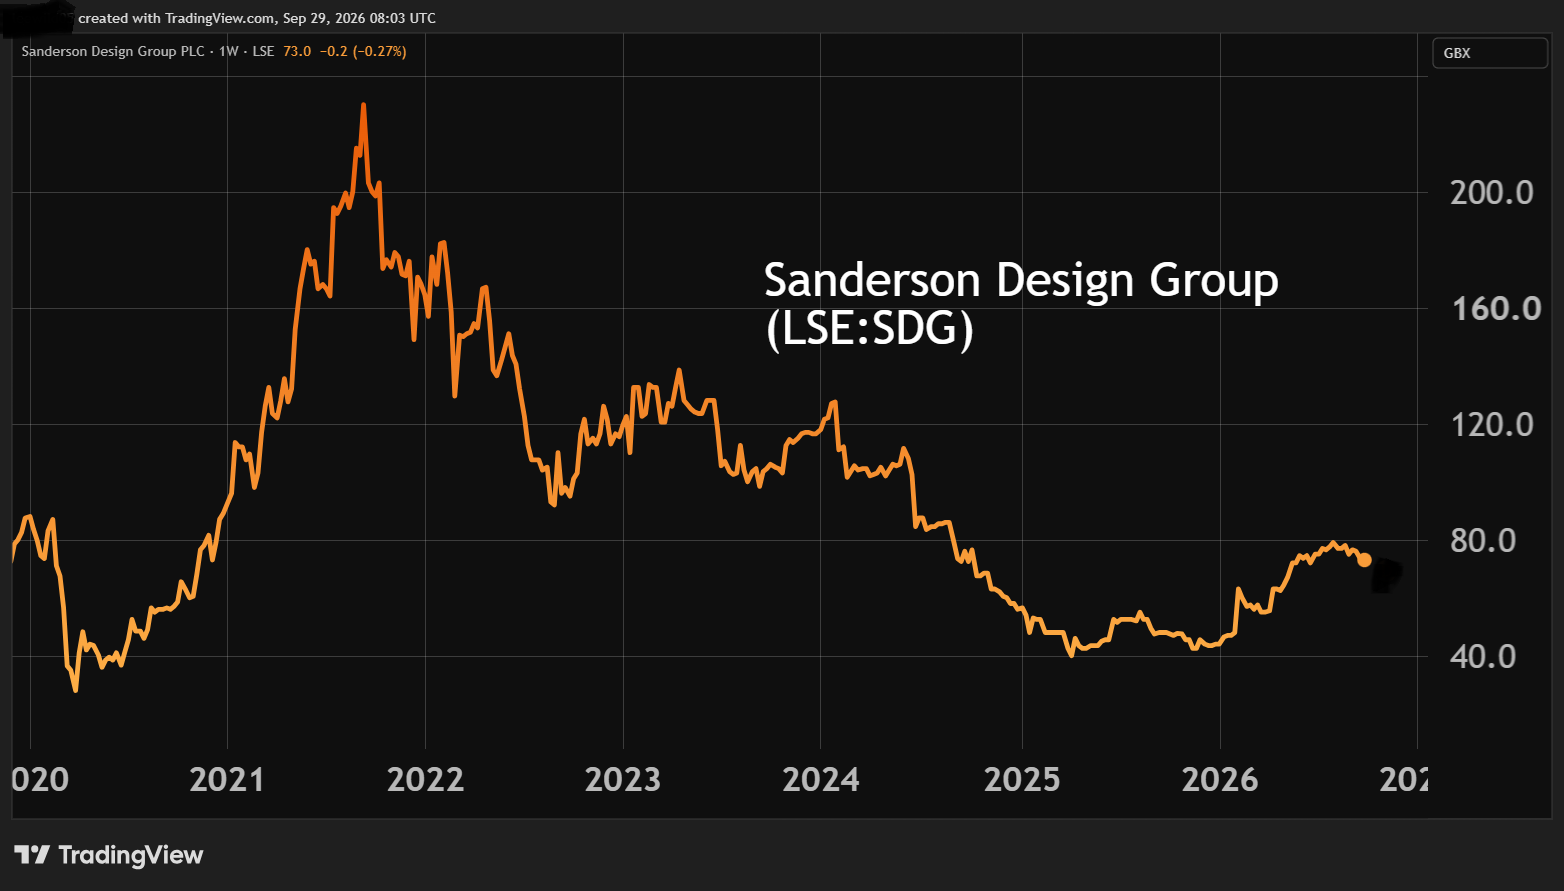
Source: TradingView. Past performance is not a guide to future performance.
The price eased 3% yesterday, recovering later to 73p on news that Sanderson’s principal shareholder has requisitioned a meeting to replace board chair Dame Dianne Thompson with Stephen Brooke. He appears to have no track record at a UK listed plc but does have a career in private equity where he is involved with Astara Capital Partners who are “committed to fundamentally improving companies”.
This would square with my sense that the stock market is undervaluing yet another British smaller company – Sanderson is capitalised near £53 million, barely half expected sales in its current financial year. It makes it vulnerable to predatory interest after management has taken decent actions but with near-term macro issues liable to hold the business back.
On the other hand, unless the US economy tanks, Sanderson’s success there could persist such that the group muddles through a challenged time ahead in the UK. In its last financial year and in terms of brands sales, the UK represented 43%, the US 32% with the remainder divided between Northern Europe and the rest of the world.
Why would key shareholder be dissatisfied with progress?
The requisition has arrived three days after a 10-year licensing agreement with Dunelm Group (LSE:DNLM) was announced, granting Sanderson sole global rights to design, manufacture and sell Designers Guild wallpapers, fabrics and paint. Sanderson is to leverage an extensive archive and brand, while Dunelm will receive royalty fees. The aim is to more fully utilise UK manufacturing facilities and distribute the products internationally. Designers Guild goes back to 1970 and is a globally recognised, luxury interiors brand.
Whether or not “a final trigger”, this seems to me a logical development, while replacing the board chair reminds of its essential role: to fire the CEO.
Deciphering the antagonists is not straightforward. Their requisition notice has arrived from Ropemaker Nominees representing LBV Actio which owns about 11.854% of the company. While LBV Actio is a registered Guernsey company specific for shareholder actions, the only disclosed holder around this level is LBV Asset Management, involved in “niche European equity strategies” covering long/short small- and mid-cap equities; which raised its stake from 12.0% to 14.1% on 10 September. Otherwise, the second largest shareholder is shown as Fidelity with 9.8%. The penalty for getting a focused position wrong is greater in small caps where shares cannot easily be sold in size.
It would appear Sanderson’s rebuttal will be that this is an attempt by a minority shareholder to gain control of the board (without making a general offer to all holders for the entire share capital), unless Brooke has ascertained support among other holders to be installed as chair, which you would think he has.
- Insider: directors pump cash into this ‘exciting growth story’
- Stockwatch: why it’s time to pay serious attention to this share
So the development is a bit odd. Why challenge stewardship if you are increasing your stake and the target is already taking worthwhile actions? A quibble could be the CEO’s £729,000 total compensation, although bonuses and incentives comprise 47.5% of this and she owns around £475,000 of equity.
It will be interesting to hear LBV’s critique in due course, assuming they put out a circular. Overall, to me it flags Sanderson as meriting attention, both financially and for getting involved whether as proactive or passive investor.
Sanderson Design Group - financial summary
year end 31 Jan
| 2016 | 2017 | 2018 | 2019 | 2020 | 2021 | 2022 | 2023 | 2024 | 2025 | 2026 | |
| Turnover (£ million) | 87.8 | 92.4 | 112 | 113 | 112 | 93.8 | 112 | 112 | 109 | 100 | 99.5 |
| Operating margin (%) | 9.3 | 8.3 | 11.8 | 5.2 | 4.3 | 5.4 | 9.2 | 9.5 | 9.0 | -14.3 | 2.5 |
| Operating profit (£m) | 8.2 | 7.7 | 13.2 | 5.9 | 4.8 | 5.1 | 10.3 | 10.6 | 9.7 | -14.4 | 2.5 |
| Net profit (£m) | 5.9 | 5.4 | 11.9 | 4.4 | 3.8 | 3.8 | 7.8 | 8.8 | 8.2 | -15.2 | 2.2 |
| Reported earnings/share (p) | 9.5 | 8.1 | 16.8 | 6.2 | 5.2 | 5.3 | 10.8 | 12.3 | 11.3 | -21.2 | 2.9 |
| Normalised earnings/share (p) | 13.8 | 25.0 | 21.6 | 10.1 | 7.0 | 5.9 | 12.6 | 14.6 | 14.1 | 3.1 | 5.1 |
| Operating cashflow/share (p) | 10.3 | 15.0 | 6.4 | 16.3 | 11.5 | 25.1 | 12.5 | 8.3 | 12.6 | -2.9 | 11.2 |
| Capex/share (p) | 4.1 | 10.2 | 4.9 | 4.2 | 3.5 | 1.5 | 3.0 | 6.7 | 4.5 | 5.7 | 0.9 |
| Free cashflow/share (p) | 6.2 | 4.8 | 1.4 | 12.0 | 8.0 | 23.6 | 9.5 | 1.6 | 8.1 | -8.6 | 10.3 |
| Dividend per share (p) | 2.9 | 3.6 | 4.4 | 3.2 | 0.5 | 0.0 | 3.5 | 3.5 | 3.5 | 1.5 | 1.5 |
| Covered by earnings (x) | 3.3 | 2.2 | 3.9 | 1.9 | 10.0 | 0.0 | 3.1 | 3.5 | 3.2 | -14.1 | 1.9 |
| Return on Total Capital (%) | 20.6 | 11.9 | 18.7 | 8.2 | 6.2 | 6.6 | 12.2 | 11.9 | 10.5 | -17.6 | 3.1 |
| Return on Equity (%) | 12.4 | 21.1 | 7.1 | 5.9 | 5.8 | 10.6 | 11.0 | 9.8 | -19.6 | 3.1 | |
| Cash (£m) | 2.9 | 1.5 | 1.3 | 2.4 | 3.1 | 15.5 | 19.1 | 15.4 | 16.3 | 5.8 | 9.8 |
| Net debt (£m) | -2.3 | 5.3 | 5.3 | -0.4 | -1.3 | -9.3 | -15.1 | -10.3 | -11.2 | 5.4 | 1.5 |
| Net assets per share (p) | 58.6 | 73.7 | 87.2 | 85.8 | 91.3 | 94.1 | 112 | 114 | 121 | 95.5 | 96.7 |
Source: Historic Company REFS and company accounts
Directors buying in July a nod to US momentum?
After a reassuring AGM on 1 July demonstrating that momentum was being sustained and expectations for the January 2027 year were unchanged, two directors bought shares at 75p. The CEO added £19.9k worth and the global commercial director £5k worth followed later by a non-executive director with £5k worth at 78p.
A 7 August update for Sanderson’s first half to 31 July clarified a 6% revenue rise as “benefiting from sustained strategic progress in focus areas and prior management actions”. Much stronger US growth of 19% for total brand product revenue offset an 8% drop in the UK. Third-party manufacturing revenue rose 19% to £11.0 million, helped by US demand, while licensing revenue rose 13% to £4.9 million following a renewal of a global Blinds2Go agreement. Direct-to-consumer revenue leapt 137% to £1.6 million, admittedly from a low base but “representing an important, high-margin, growth area”.
That the shares trade at an 11% discount to net tangible assets seems to me essentially a “failure of free market economics” rather than what the company is doing.
- AIM’s best companies of 2026: shortlist revealed
- Shares for the future: hidden risks at this stock prey on my mind
- Sign up to our free newsletter for investment ideas, latest news and award-winning analysis
Sanderson has positioned itself well in the US – the world’s largest market for textiles and wallpapers – benefiting from an expanded network plus ability to create designs aligned to significant demand from US buyers. The Highgrove Collection launched in May 2025 is enjoying strong sales in all regions ahead of management expectations and has helped Sanderson-specific US brand sales grow 45% in the first half.
The US is the group’s most profitable, fastest-growing region, and if momentum continues, then despite 26% normalised earnings per share (EPS) growth being consensus for the January 2027 year, Sanderson could surprise on the upside. Any damage from US tariffs appeared to happen in the second half of the previous financial year. Obviously, a check to this progress could be if the UK market worsens.
Low valuation plus a 3% yield
At 73p, the January 2027 price/earnings (PE) ratio would be 11.4x, assuming consensus for EPS of 6.4p, easing to 9.7x if 7.5p is achieved to 2028. This would still be around 30% down on performance around four years’ previous because costs have risen.
Dividend per share is also recovering from 1.5p to the 2.0p expected this year and 2.1p next, giving a circa 3% prospective yield.
Possibly the UK takes some shine off US progress, and a worst-case scenario would be persistently high energy prices eventually crimping the US economy. But they appear to chiefly affect lower-income people there rather than Sanderson’s wealthier customers.
Despite the macro risks, I retain a “buy” stance in respect of Sanderson’s long-term intrinsic value where for example intangibles constituted barely 15% of last January’s net asset value – yet the business owns powerful brands.
Interim results are due Wednesday 21 October.
Edmond Jackson is a freelance contributor and not a direct employee of interactive investor.
These articles are provided for information purposes only. Occasionally, an opinion about whether to buy or sell a specific investment may be provided by third parties. The content is not intended to be a personal recommendation to buy or sell any financial instrument or product, or to adopt any investment strategy as it is not provided based on an assessment of your investing knowledge and experience, your financial situation or your investment objectives. The value of your investments, and the income derived from them, may go down as well as up. You may not get back all the money that you invest. The investments referred to in this article may not be suitable for all investors, and if in doubt, an investor should seek advice from a qualified investment adviser.
Full performance can be found on the company or index summary page on the interactive investor website. Simply click on the company's or index name highlighted in the article.
Disclosure
We use a combination of fundamental and technical analysis in forming our view as to the valuation and prospects of an investment. Where relevant we have set out those particular matters we think are important in the above article, but further detail can be found here.
Please note that our article on this investment should not be considered to be a regular publication.
Details of all recommendations issued by ii during the previous 12-month period can be found here.
ii adheres to a strict code of conduct. Contributors may hold shares or have other interests in companies included in these portfolios, which could create a conflict of interests. Contributors intending to write about any financial instruments in which they have an interest are required to disclose such interest to ii and in the article itself. ii will at all times consider whether such interest impairs the objectivity of the recommendation.
In addition, individuals involved in the production of investment articles are subject to a personal account dealing restriction, which prevents them from placing a transaction in the specified instrument(s) for a period before and for five working days after such publication. This is to avoid personal interests conflicting with the interests of the recipients of those investment articles.