Stockwatch: share surge could be sign of better times ahead
A sudden jump in the value of this company has got analyst Edmond Jackson excited and puts his ‘buy’ tip deep in the money. This is what he’d do now.
17th February 2026 10:54
by Edmond Jackson from interactive investor

The AIM-listed shares in Sanderson Design Group Ordinary Shares (LSE:SDG) have finally woken up – surging more than 30% from around 48p to 65p; they currently sit at around 61.5p. The move followed an update for the full year to 31 January 2026.
While there was no upgrade to profit guidance, the outlook statement cited “increasing momentum in the business, particularly in the US, manufacturing and (new) direct-to-consumer (means of sales), although UK trading conditions remain subdued.”
- Invest with ii: Top UK Shares | Share Tips & Ideas | Open a Trading Account
It looked as if buyers sensed the prospect of a potentially sharp profits rebound should static sales improve after a recent cost-cutting programme. Challenging conditions have resulted from a relatively weaker housing market, especially at the high-value end more likely to involve Sanderson’s luxury interior furnishings.
This group designs, manufactures and markets premium wallpaper, fabrics and paints, hence is significantly geared to the housing market where makeovers are more likely when people move in and put their own stamp on a property. Discretionary consumer spending is also a factor. Neither has been in strong supply in recent years, hence the share’s de-rating from over 600p since 2021.
I drew attention to the company a year ago at 48p – representing 0.6x net tangible asset value and at a market value below the £42.5 million paid for just one business in the portfolio, Lancashire-based Clarke & Clarke in 2016. I suspected Sanderson could end up being a takeover target, so preferred not to be cute on timing. Obviously, that hasn’t happened, but its odds may have just increased.
The crux is whether early green shoots are sustained. The US is Sanderson’s target growth market where affluent people are largely insulated from price rises and employment fears, which accounted for an unexpected down-dip in December US consumer confidence. Yet if the stock market plunges, high rollers could similarly be affected.
- The Income Investor: a FTSE 100 retailer with dividend appeal
- Insider: FTSE 100 directors spot bargains after AI sell-off
Here in the UK, the rise in stamp duty from last April (reverting to pre-September 2022 levels) hasn’t helped, and the mansion tax from April 2028 is already hitting sales of properties around the £2 million threshold upwards.
A tantalising combination of variables
Sanderson’s chart is potentially looking like a bullish “bowl”, both visibly and in terms of its reference to “increasing momentum”.
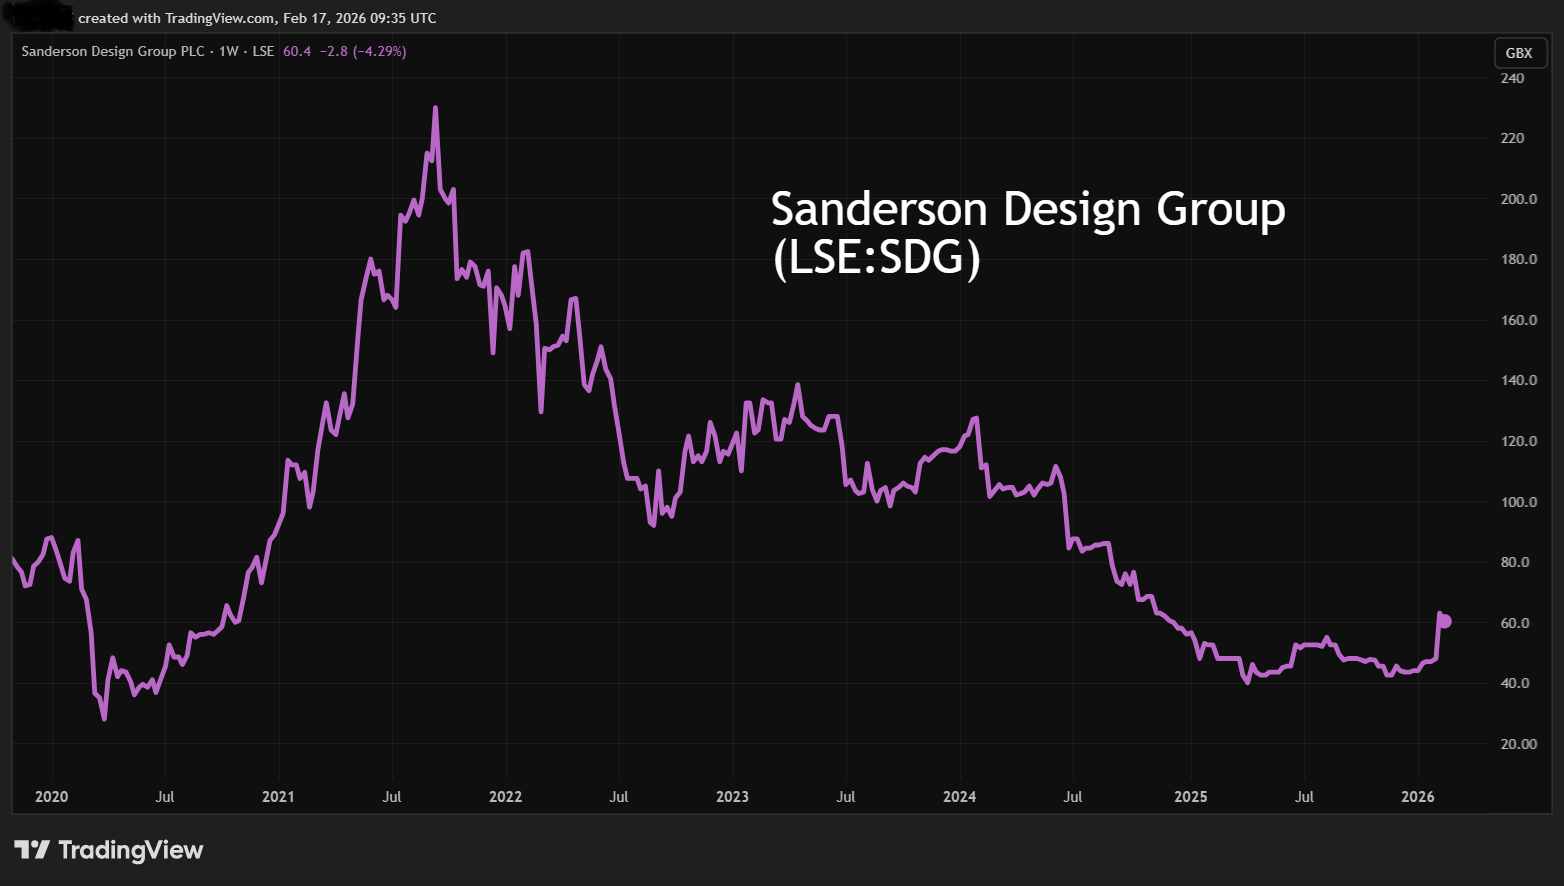
Source: TradingView. Past performance is not a guide to future performance.
Consensus is for net profit rising from £3.5 million to £4.3 million in January 2027, implying a 23% rise in earnings per share (EPS) to 6.5p, hence a forward price/earnings (PE) ratio of 9.5x, making the PEG (PE/Growth) currently look very attractive at 0.4 – albeit within a short time frame when earnings look as if they are recovering from a low base.
The summary table shows nearly £12 million of net profit achieved in the January 2018 year, the effect of Covid lockdowns swelling household finances, plus “working from home” resulting in a profit boost to around £8 million in three years following Covid.
There could potentially be a recovery to at least median between these good years and more challenged times during 2024, especially after a tighter approach to costs.
- Sign up to our free newsletter for investment ideas, latest news and award-winning analysis
- 10 hottest ISA shares, funds and trusts: week ended 13 February 2026
Reported losses manifested in respect of the January 2025 year due to £16.3 million non-cash impairment of intangible assets from the Clarke & Clarke acquisition which, in hindsight, Sanderson looks to have overpaid for. Management said this was to align the brand with current industry valuations and remained confident in its importance to the group.
It left the 31 July 2025 balance sheet with £10.7 million of intangibles, or 15% of £69.2 million net assets. So, it’s not as if asset value is exposed to further material downgrades should the consumer environment worsen.
Half-year cash rose from £5.8 million to £7.8 million year-on-year, and the latest update cites a further rise to £9.8 million at the end of January due to further stock reductions, working capital management and controlled capital expenditure. There is no bank debt beyond £10.9 million leases.
Sanderson Design Group - financial summary
year end 31 Jan
| 2016 | 2017 | 2018 | 2019 | 2020 | 2021 | 2022 | 2023 | 2024 | 2025 | |
| Turnover (£ million) | 87.8 | 92.4 | 112 | 113 | 112 | 93.8 | 112 | 112 | 109 | 100 |
| Operating margin (%) | 9.3 | 8.3 | 11.8 | 5.2 | 4.3 | 5.4 | 9.2 | 9.5 | 9.0 | -14.3 |
| Operating profit (£m) | 8.2 | 7.7 | 13.2 | 5.9 | 4.8 | 5.1 | 10.3 | 10.6 | 9.7 | -14.4 |
| Net profit (£m) | 5.9 | 5.4 | 11.9 | 4.4 | 3.8 | 3.8 | 7.8 | 8.8 | 8.2 | -15.2 |
| Reported earnings/share (p) | 9.5 | 8.1 | 16.8 | 6.2 | 5.2 | 5.3 | 10.8 | 12.3 | 11.3 | -21.2 |
| Normalised earnings/share (p) | 13.8 | 25.0 | 21.6 | 10.1 | 7.0 | 5.9 | 12.6 | 14.6 | 14.1 | 3.1 |
| Operating cashflow/share (p) | 10.3 | 15.0 | 6.4 | 16.3 | 11.5 | 25.1 | 12.5 | 8.3 | 12.6 | -2.9 |
| Capex/share (p) | 4.1 | 10.2 | 4.9 | 4.2 | 3.5 | 1.5 | 3.0 | 6.7 | 4.5 | 5.7 |
| Free cashflow/share (p) | 6.2 | 4.8 | 1.4 | 12.0 | 8.0 | 23.6 | 9.5 | 1.6 | 8.1 | -8.6 |
| Dividend per share (p) | 2.9 | 3.6 | 4.4 | 3.2 | 0.5 | 0.0 | 3.5 | 3.5 | 3.5 | 1.5 |
| Covered by earnings (x) | 3.3 | 2.2 | 3.9 | 1.9 | 10.0 | 0.0 | 3.1 | 3.5 | 3.2 | -14.1 |
| Return on Total Capital (%) | 20.6 | 11.9 | 18.7 | 8.2 | 6.2 | 6.6 | 12.2 | 11.9 | 10.5 | -17.6 |
| Return on Equity (%) | 12.4 | 21.1 | 7.1 | 5.9 | 5.8 | 10.6 | 11.0 | 9.8 | -19.6 | |
| Cash (£m) | 2.9 | 1.5 | 1.3 | 2.4 | 3.1 | 15.5 | 19.1 | 15.4 | 16.3 | 5.8 |
| Net debt (£m) | -2.3 | 5.3 | 5.3 | -0.4 | -1.3 | -9.3 | -15.1 | -10.3 | -11.2 | 5.4 |
| Net assets per share (p) | 58.6 | 73.7 | 87.2 | 85.8 | 91.3 | 94.1 | 112 | 114 | 121 | 95.5 |
Source: historic company REFS and company accounts.
All depends on whether the US stock market holds up
I believe Wall Street’s resilience is quite the crux however odd it seems. The US is Sanderson’s professed targeted growth market where affluent consumers have benefited from a roaring bull market. Last year, the US represented 32% of brand sales, and the UK 43%, with the remainder divided equally between northern Europe and rest-of-world.
Affluent Americans, feeling buoyant from their home and equity portfolio values, drove US brand product sales up 5% in the last year, or by 9% at constant currency. There was double-digit growth early in the year, hit in the second quarter by tariff uncertainty, then a “strong” recovery in the second half with sales up 6%, or 10% at constant currency including surcharges implemented to mitigate tariffcosts. This is reassuring in the sense of affluent consumers absorbing tariffs. But what if confidence takes a hit?
Otherwise, Northern Europe edged up just 3% - effectively explained by wider inflation, certainly when considering rest-of-world was flat. These two regions, at £17.8 million, comprise 25% of brand product revenue. Manufacturing revenue slipped 6% overall to £29.7 million and licence revenue by 5% to £10.5 million, hence annual group revenue was 1% softer at £99.5 million.
- Stockwatch: can an activist investor improve this FTSE 100 share?
- Shares for the future: fresh news forces update on five stocks
It is encouraging how the new financial year is starting well, although mind how last year’s shifts and somewhat divergent performances imply any tendency towards consumer recession would see green shoots perish.
However, holders can take comfort in how end of July net tangible assets per share was 81p, hence such risk remains well priced-in.
New direct-to-consumer channel could boost sales
This initiative has been applied progressively last year to all the brands, although it’s too early to guess what upside there might be, and if there’s an aspect of catch-up with the competition. At least early sales are encouraging.
In the last year, the company said the sales boost was “primarily from Morris & Co, £1.8 million up from £0.4 million, with a substantial amount of the growth coming from the US from new customer audiences”.
Despite its challenges, Sanderson has continued to pay dividends, with a total of near 1.7p per share the consensus for the year to January 2027, up from 1.5p. That’s puts the yield near 3.5% on my 48p suggested “buy” price.
Annual results are expected in late April, hence I would be surprised if Sanderson is already in a restricted period on director dealings now the essence of the January 2026 year and outlook is in the public domain. As yet there have been no share purchases on the back of “increasing momentum”, the last being a non-executive director buying £19,600 worth at 49p per share last October. In August, the global commercial director bought £4,000 worth at 55p. Otherwise, executives were simply exercising nil-cost options last November, but at least didn’t sell any shares arising.
I retain a “buy” stance given that there seems more risk priced into Sanderson shares than is due, plus takeover prospects, despite ongoing scope for variability in its narrative. If wealthy US consumers remain resilient, then a “bowl” chart stands a good chance of continuing to form.
Edmond Jackson is a freelance contributor and not a direct employee of interactive investor.
AIM stocks tend to be volatile high-risk/high-reward investments and are intended for people with an appropriate degree of equity trading knowledge and experience.
These articles are provided for information purposes only. Occasionally, an opinion about whether to buy or sell a specific investment may be provided by third parties. The content is not intended to be a personal recommendation to buy or sell any financial instrument or product, or to adopt any investment strategy as it is not provided based on an assessment of your investing knowledge and experience, your financial situation or your investment objectives. The value of your investments, and the income derived from them, may go down as well as up. You may not get back all the money that you invest. The investments referred to in this article may not be suitable for all investors, and if in doubt, an investor should seek advice from a qualified investment adviser.
Full performance can be found on the company or index summary page on the interactive investor website. Simply click on the company's or index name highlighted in the article.
Disclosure
We use a combination of fundamental and technical analysis in forming our view as to the valuation and prospects of an investment. Where relevant we have set out those particular matters we think are important in the above article, but further detail can be found here.
Please note that our article on this investment should not be considered to be a regular publication.
Details of all recommendations issued by ii during the previous 12-month period can be found here.
ii adheres to a strict code of conduct. Contributors may hold shares or have other interests in companies included in these portfolios, which could create a conflict of interests. Contributors intending to write about any financial instruments in which they have an interest are required to disclose such interest to ii and in the article itself. ii will at all times consider whether such interest impairs the objectivity of the recommendation.
In addition, individuals involved in the production of investment articles are subject to a personal account dealing restriction, which prevents them from placing a transaction in the specified instrument(s) for a period before and for five working days after such publication. This is to avoid personal interests conflicting with the interests of the recipients of those investment articles.