Best dividend opportunities for investment trust fans
As income investors brace for impact, we ask which trusts are less likely to cut their dividends.
19th June 2020 15:54
This content is provided by Kepler Trust Intelligence, an investment trust focused website for private and professional investors. Kepler Trust Intelligence is a third-party supplier and not part of interactive investor. It is provided for information only and does not constitute a personal recommendation.
Material produced by Kepler Trust Intelligence should be considered a marketing communication, and is not independent research.
As income investors brace for impact we investigate which regions and trusts are less likely to cut their dividends in 2020.

William Sobczak is an analyst at Kepler Trust Intelligence.
Gimme shelter
The coronavirus pandemic has caused dividends to be cancelled or cut across the world, but the impact has yet to be fully felt – with more bad news likely to come in the second half of the year. Pressure has come through reduced revenues, due to a slowdown in economic activity and a regulatory interference in dividends being paid by industries which have received taxpayer support.
The task for income investors is to identify the regions and sectors which are expected to be less affected; to which the Janus Henderson Dividend Index report has made an important contribution.
In this article we summarise the key findings from the detailed report and apply them to the investment trust sectors, highlighting where we think the best opportunities lie.
Janus Henderson Global Dividend Index
According to the report, global payouts actually rose 3.6% in Q1 – on a headline growth rate basis (the change in the total value of dividends paid) – to a first-quarter record of $275.4 billion, despite the pandemic.
This figure is the equivalent to an underlying growth of 4.3%. Additionally, a number of countries, like the US and Canada, posted all-time quarterly record payouts.
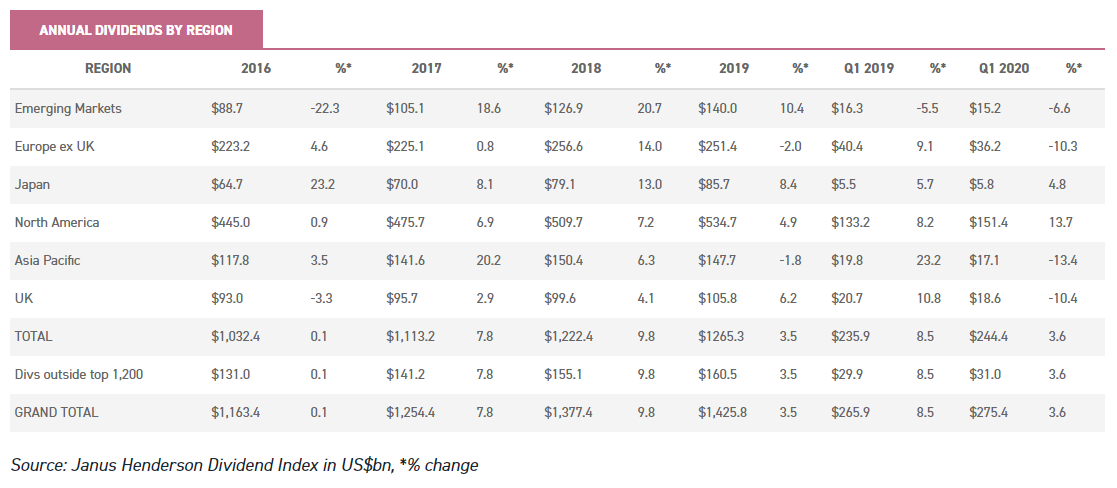
However the report anticipates that the full impact of the crisis will be seen over the coming twelve months. The best-case scenario, that Janus Henderson envisages over this period, is a decline in global dividends of 15% to $1.21 trillion: a drop of $213 billion.
By contrast, in a worst-case scenario situation, they predict a decline of 35% this year to $933 billion: though this decrease would be unevenly distributed across different regions.
One can see the percentage of dividends which are considered to be safe, vulnerable or have already been cut depending upon region in the chart below.
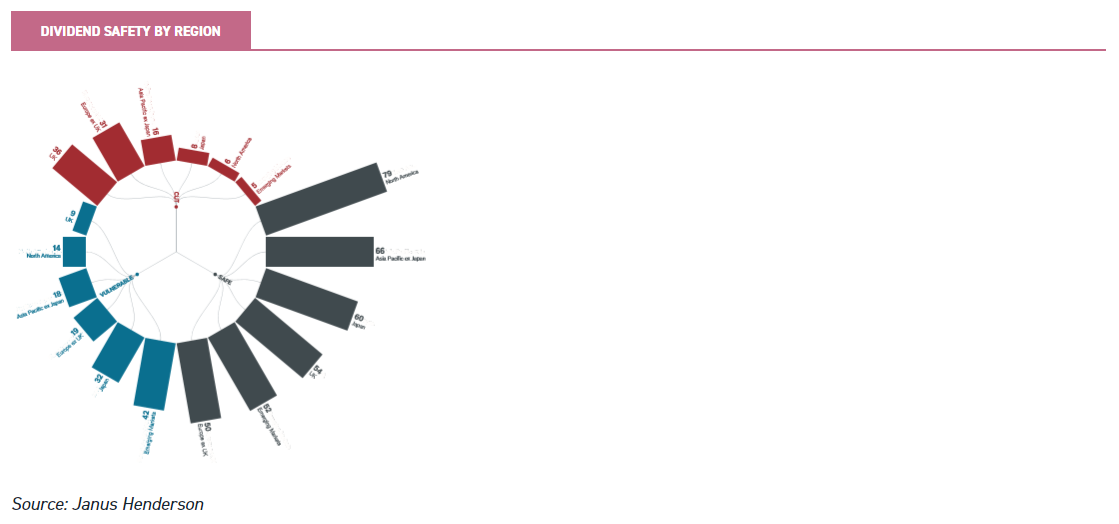
The report identifies seven different factors that could determine the severity of the dividend cuts across regions:
- Magnitude of epidemic: How extensive is the virus?
- Severity of lockdown: How badly is the economy being impacted?
- Policy response: How are central banks and government aiding the economy and companies?
- Regulation: How severe are regulatory demands?
- Sector mix: Weighting towards more or less impacted industries?
- Dividend seasonality: Seasonality of dividends, and when will the impact be felt?
- Dividend policy: How high are dividends compared to profits, and do companies favour a target payout ratio or a progressive dividend policy?
As for sector mix, it was found that the dividends of banks, consumer discretionary stocks and certain industrial sectors – such as aerospace – were the most at risk.
The JHDI report also identified weaknesses in the oil and mining sectors, wider financials and construction.
On the other hand, it noted that technology companies were relatively unaffected; as were the defensive sectors including the likes of healthcare, food, and most consumer basics.
North America
The report suggested that – in terms of dividend payments – North America is one of the areas less likely to be severely affected by the Covid-19 pandemic.
One reason for this stability is that most companies pay their dividends quarterly, making it easier for any suspension to be relatively short-lived: companies adapt dividend policy to reflect their underlying business performance.
On average US companies also spend more of their free cash flow on share buybacks, as opposed to dividends, unlike companies in Europe. As a result share buybacks – rather than dividends – are being eliminated by management in the US, in an effort to preserve capital.
The sector mix in the US is also relatively favorable. Technology companies are among those less impacted by the pandemic, and many of the ‘FAANG’ companies have net cash on their balance sheets.
Some may even benefit from increased demand due to Covid-19 driven changes in corporate and consumer behaviours. The US healthcare and consumer basics sectors also contribute more to US dividends than elsewhere, both are likely to weather the crisis better.
North America is not typically an area that investors have looked towards for income, with the average yield sitting at 2.2% and only three trusts yielding more than 1.5%.
Trusts within this sector have also been trading at an average discount of 4.8%, which is tighter than most sectors.
Below we list the income-generating North American investment trusts, along with some key metrics for dividend security: revenue reserves and their weighting to the sectors identified as relatively safe by JHDI.
Interestingly neither of the two income-generating investment trusts, BlackRock North American (LSE:BRNA) and North American Income Trust (LSE:NAIT), have large allocations to technology. Instead both favour healthcare, consumer defensives and financials.
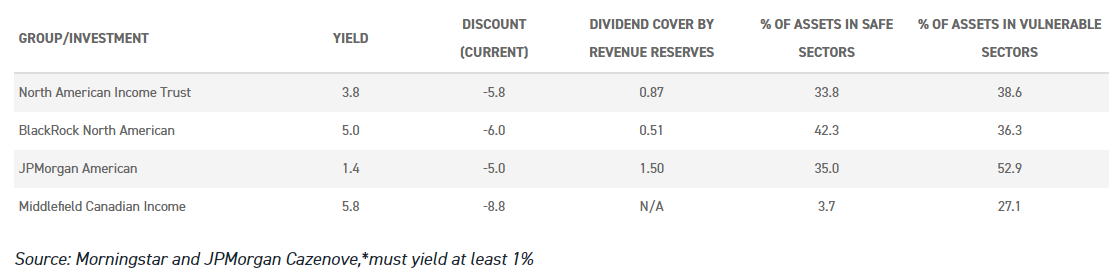
BlackRock North American (LSE:BRNA) is the highest yielding trust in the AIC North American sector (5%) and has clear appeal for income reliant investors. BRNA’s most recent annual dividend was covered 0.51x by revenue reserves. In addition to the previously discussed benefits of having US companies in the portfolio, BRNA also has the capacity to pay dividends from capital. In 2019, for example, 75% of the full year dividend came from portfolio income, the remainder from capital and reserves.
North American Income Trust (LSE:NAIT) – managed by Standard Life Aberdeen (LSE:SLA) – on the other hand currently yields 3.8%. The board and managers have also made excellent progress in building up a significant revenue reserve – almost a full year’s worth of dividends. Whereas five years ago they had nothing in their revenue reserves.
Both BRNA and NAIT write options as a way to enhance income. Whilst this adds complexity to the portfolios, making it harder for ordinary investors to understand what their managers are doing, it can be an advantage. The greater volatility of markets recently has increased the level of premiums received for this and, as a result, has made the dividend-paying capabilities of the trusts more reliable.
Europe
The Covid-19 pandemic has hit European companies particularly hard. The ECB’s ban on banks paying dividends this year has knocked at least $1 in $7 off European payouts.
Not only have distributions for this year been cancelled, but next year’s are likely to be hit by the crisis too. In addition most European companies make just one dividend payment per year, mainly during Q2, whereas US companies pay quarterly dividend payments.
Most parts of Europe have seen robust government schemes to support companies. JHDI believes that this will provide some protection for the economy.
But those taking this support may be in a politically difficult situation to pay dividends, or at the very least will have to reduce them.
Janus Henderson anticipates that European dividends will be amongst the hardest hit of our global regions.
Nonetheless they highlight the possibility that some suspended dividends may yet be paid later in the year – if the crisis abates – rather than end up being forfeited altogether.
The European sector offers a number of trusts yielding more than 3%, although the average yield is 2.9%. Other than in the Emerging markets European trusts are trading at significantly wider discounts than most, with an average discount of 9.5%.
The ability of trusts to pay their dividends very much depends on the regions in which they are investing. According to the report, the greatest impact of Covid-19 will be felt in France.
It is Europe’s largest dividend payer and has been through a prolonged lockdown. It also has large exposures to economically sensitive businesses, and political control is of a relatively high degree.
Germany, on the other hand, has managed the epidemic well – according to JHDI – and has a more favourable sector mix.
Moreover its weaker banks have already cut payouts, so the ECB prohibition should have less of an impact.
Swiss company dividends will likely escape the adversity relatively unscathed: banking groups are pressing ahead with their payouts and pharmaceutical dividends have already been paid this year. Most other major Swiss companies also seem secure.
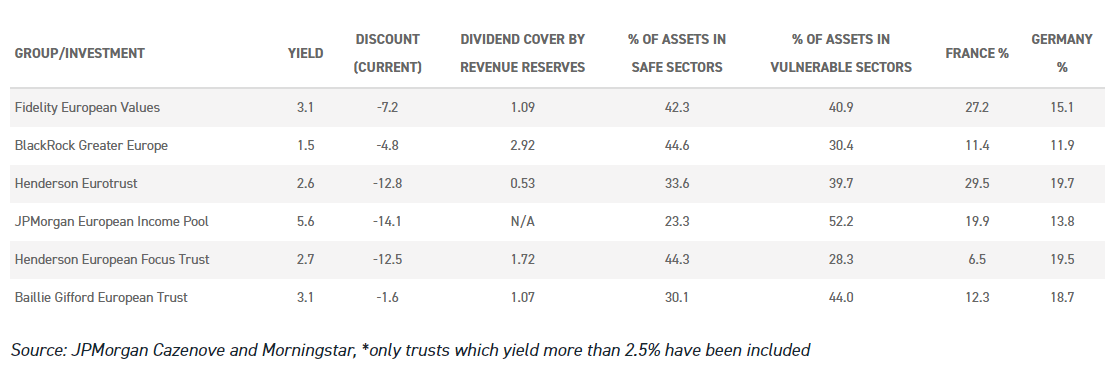
Source: JPMorgan Cazenove and Morningstar, *only trusts which yield more than 2.5% have been included
JPMorgan European Income Pool (LSE:JETI), offers a relatively high yield of 5.6%. However, there are other optiosn for investors including Baillie Gifford European Growth (LSE:BGEU).
Although income isn’t a focus for the trust, BGEU is currently trading at a discount of 3.1% and has been able to grow its dividend at a rate of 17.2% over the past five years.
Currently yielding 3.1%, the majority of the trust’s assets sit within countries that the report identifies as being relatively safe; while its portfolio is tilted towards cyclicals and industrials, and away from financial services.
Additionally the trust has built up significant revenue reserves, which covered the most recent full-year dividend.
Asia and Emerging Markets
Last year the Asia /Pacific region accounted for 12% of world dividends, with the financial sector being the largest contributor.
The first quarter of 2020, however, saw a 7% decline in dividends across the sector. Although Asian banks are relatively well capitalised and have low payout ratios, this has been insufficient to offset the reduced level of dividends now deriving from the Australian banks.
In Australia – as in the UK and Europe – regulators have put pressure on the banking sector to pass their dividends, whereas Asian banks have maintained theirs.
Despite this, the report has identified Asian companies as being relatively well positioned to pay dividends this year.
The impact of Covid-19 has not been as severe as in the West, and countries like Taiwan and Hong Kong have been distributing their profits from 2019 without interruption. The report expects this to continue through 2020.
The Asian Equity Income sector is one of the highest yielding sectors, with an average yield of 5.4%. There is a large disparity among the trusts in terms of how they trade relative to NAV: Henderson Far East Income (LSE:HFEL) and JPMorgan Asia Growth & Income (LSE:JAGI) are trading close to NAV, but Aberdeen Asian Income (LSE:AAIF) and Schroder Oriental Income (LSE:SOI) trading at discounts of 12.1 and 5.2% respectively.
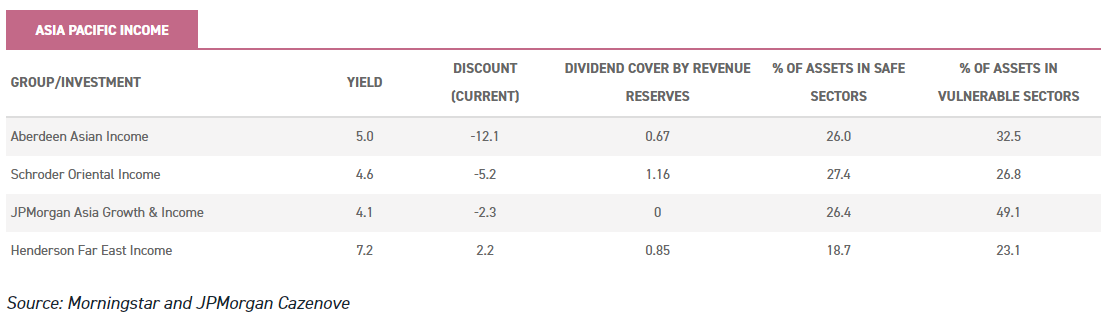
According to Schroder Oriental Income (LSE:SOI), cash flow strength and balance sheet resilience was relatively strong in the Asian sector when entering into the crisis.
Payout ratios were not particularly high, relative to historic levels, and corporate leverage was the lowest of any major region.
Furthermore many Asian companies are increasingly focused on dividends, as part of shareholder total returns.
The trust currently yields 4.6% and trades at a discount of 5.2%. The trust has large sector exposure to communication services, technology and real estate: the majority of the companies are domiciled in Taiwan and Hong Kong.
Henderson Far East Income (LSE:HFEL) is the highest yielding trust (7.2%), and the only trust to trade at a premium (2.2%).
The manager, Michael Kerly, claims that history shows Asia is a strong area to invest in for dividends during a crisis; as was illustrated in 2008 when the whole financial system went into crisis and companies in the MSCI Asia Pacific ex Japan Index responded: 45% of companies cut their dividend, 32% increased it and 23% held it at the same level.
The trust sits on our income shortlist and has paid two quarterly dividends, up to the February 2020 half year report, amounting to 11.4p – a 3.6% increase on the same period in the prior year.
To boost income the trust writes put and call options, which allows it to include lower-yielding companies with higher dividend growth.
This strategy should boost total returns and income growth over the medium term. Currently the main sectoral allocations are towards financials, telecommunications and technology. The largest geographical allocations are in China, Australia and Taiwan.
Emerging Markets
In 2019 Emerging Markets accounted for 11% of world dividends. Data from the Janus Henderson Global Dividend Index report shows that the first quarter of 2020 saw underlying dividend growth in excess of 12%.
The dividend patterns illustrated here, however, are quite different to mature markets and it is probably unwise to make straight comparisons. In addition the lagged effect of the pandemic may skew the timing of the economic impact on different countries within this region.
One might expect China to recover sooner than Brazil, for example, as the pandemic is still very much prevalent in the latter. China – although the first to suffer from Covid-19 – has recovered quickly, and the impact on dividends is likely to be less severe than perhaps feared.
Bank dividends in China contribute a significant percentage of dividend income from this area. As a result they are seen as more than likely to be maintained, especially given the high levels of state shareholdings.
In Russia the weakness of resource prices (particularly oil) through the pandemic, may leave dividends vulnerable. Brazil is additionally affected by weak commodity prices, and the fact that the fiscal stimulus in Latin America has been muted compared to the rest of the world. India has also had a subdued fiscal response to Covid-19, constrained as it is by its fiscal deficit.
For these reasons it is hard to reasonably predict Emerging Market dividend income in the next few quarters with much certainty.
However the Global Emerging markets sector trades at the widest discount of the areas we have looked at, with an average of 11.4%. On average trusts offer a yield of 3.1%, although there are a number of significantly greater income opportunities.
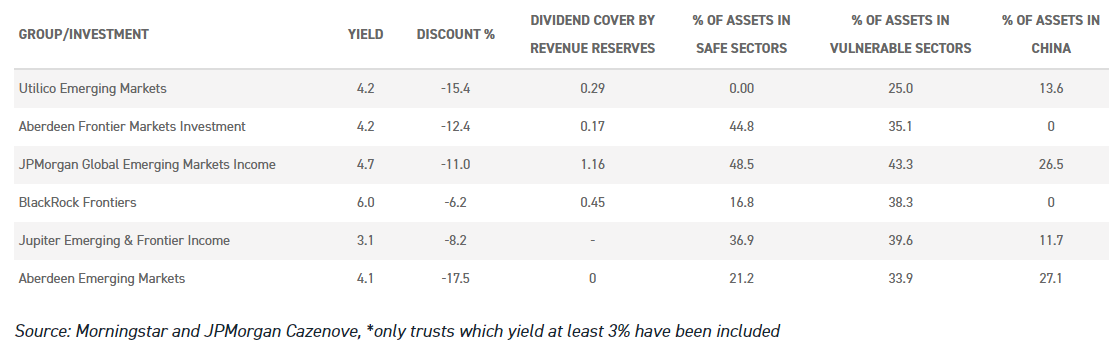
Source: Morningstar and JPMorgan Cazenove, *only trusts which yield at least 3% have been included
BlackRock Frontiers (LSE:BRFI) is a standout trust in the sector. Currently the trust trades at a discount of 6.2% and offers a yield of 6.0%. Generating income is not a specific objective for the managers, but the board has made it clear that it views the dividend as an important part of investors’ total return.
The portfolio’s geographical exposure is well split: with Indonesia, Thailand and Vietnam accounting for the largest proportions. At a sectoral level financials is comfortably the largest exposure, followed by consumer discretionary and consumer staples.
An alternative option, outside the Global Emerging markets sector, is Baring Emerging Europe (LSE:BEE).
BEE is the only closed-ended fund focused on Emerging Europe after the wind up of BlackRock Emerging Europe in 2018. In 2017 it was announced that dividends would be more of a focus for the trust and that the company may now pay out up to 1% of NAV from capital to support the dividend. The trust has a yield of 5.2 % and trades at a discount of 11%.
Energy, financial services and communication services make up the largest sectoral allocations and the portfolio is dominated by companies in Russia, Poland and Turkey.
Kepler Partners is a third-party supplier and not part of interactive investor. Neither Kepler Partners or interactive investor will be responsible for any losses that may be incurred as a result of a trading idea.
Full performance can be found on the company or index summary page on the interactive investor website. Simply click on the company's or index name highlighted in the article.
Important Information
Kepler Partners is not authorised to make recommendations to Retail Clients. This report is based on factual information only, and is solely for information purposes only and any views contained in it must not be construed as investment or tax advice or a recommendation to buy, sell or take any action in relation to any investment.
This report has been issued by Kepler Partners LLP solely for information purposes only and the views contained in it must not be construed as investment or tax advice or a recommendation to buy, sell or take any action in relation to any investment. If you are unclear about any of the information on this website or its suitability for you, please contact your financial or tax adviser, or an independent financial or tax adviser before making any investment or financial decisions.
The information provided on this website is not intended for distribution to, or use by, any person or entity in any jurisdiction or country where such distribution or use would be contrary to law or regulation or which would subject Kepler Partners LLP to any registration requirement within such jurisdiction or country. Persons who access this information are required to inform themselves and to comply with any such restrictions. In particular, this website is exclusively for non-US Persons. The information in this website is not for distribution to and does not constitute an offer to sell or the solicitation of any offer to buy any securities in the United States of America to or for the benefit of US Persons.
This is a marketing document, should be considered non-independent research and is subject to the rules in COBS 12.3 relating to such research. It has not been prepared in accordance with legal requirements designed to promote the independence of investment research.
No representation or warranty, express or implied, is given by any person as to the accuracy or completeness of the information and no responsibility or liability is accepted for the accuracy or sufficiency of any of the information, for any errors, omissions or misstatements, negligent or otherwise. Any views and opinions, whilst given in good faith, are subject to change without notice.
This is not an official confirmation of terms and is not to be taken as advice to take any action in relation to any investment mentioned herein. Any prices or quotations contained herein are indicative only.
Kepler Partners LLP (including its partners, employees and representatives) or a connected person may have positions in or options on the securities detailed in this report, and may buy, sell or offer to purchase or sell such securities from time to time, but will at all times be subject to restrictions imposed by the firm's internal rules. A copy of the firm's conflict of interest policy is available on request.
Past performance is not necessarily a guide to the future. The value of investments can fall as well as rise and you may get back less than you invested when you decide to sell your investments. It is strongly recommended that Independent financial advice should be taken before entering into any financial transaction.
PLEASE SEE ALSO OUR TERMS AND CONDITIONS
Kepler Partners LLP is a limited liability partnership registered in England and Wales at 9/10 Savile Row, London W1S 3PF with registered number OC334771.
Kepler Partners LLP is authorised and regulated by the Financial Conduct Authority.
Kepler Partners is a third-party supplier and not part of interactive investor. Neither Kepler Partners or interactive investor will be responsible for any losses that may be incurred as a result of a trading idea.
These articles are provided for information purposes only. Occasionally, an opinion about whether to buy or sell a specific investment may be provided by third parties. The content is not intended to be a personal recommendation to buy or sell any financial instrument or product, or to adopt any investment strategy as it is not provided based on an assessment of your investing knowledge and experience, your financial situation or your investment objectives. The value of your investments, and the income derived from them, may go down as well as up. You may not get back all the money that you invest. The investments referred to in this article may not be suitable for all investors, and if in doubt, an investor should seek advice from a qualified investment adviser.
Full performance can be found on the company or index summary page on the interactive investor website. Simply click on the company's or index name highlighted in the article.
Important Information
Kepler Partners is not authorised to make recommendations to Retail Clients. This report is based on factual information only, and is solely for information purposes only and any views contained in it must not be construed as investment or tax advice or a recommendation to buy, sell or take any action in relation to any investment.
This report has been issued by Kepler Partners LLP solely for information purposes only and the views contained in it must not be construed as investment or tax advice or a recommendation to buy, sell or take any action in relation to any investment. If you are unclear about any of the information on this website or its suitability for you, please contact your financial or tax adviser, or an independent financial or tax adviser before making any investment or financial decisions.
The information provided on this website is not intended for distribution to, or use by, any person or entity in any jurisdiction or country where such distribution or use would be contrary to law or regulation or which would subject Kepler Partners LLP to any registration requirement within such jurisdiction or country. Persons who access this information are required to inform themselves and to comply with any such restrictions. In particular, this website is exclusively for non-US Persons. The information in this website is not for distribution to and does not constitute an offer to sell or the solicitation of any offer to buy any securities in the United States of America to or for the benefit of US Persons.
This is a marketing document, should be considered non-independent research and is subject to the rules in COBS 12.3 relating to such research. It has not been prepared in accordance with legal requirements designed to promote the independence of investment research.
No representation or warranty, express or implied, is given by any person as to the accuracy or completeness of the information and no responsibility or liability is accepted for the accuracy or sufficiency of any of the information, for any errors, omissions or misstatements, negligent or otherwise. Any views and opinions, whilst given in good faith, are subject to change without notice.
This is not an official confirmation of terms and is not to be taken as advice to take any action in relation to any investment mentioned herein. Any prices or quotations contained herein are indicative only.
Kepler Partners LLP (including its partners, employees and representatives) or a connected person may have positions in or options on the securities detailed in this report, and may buy, sell or offer to purchase or sell such securities from time to time, but will at all times be subject to restrictions imposed by the firm's internal rules. A copy of the firm's conflict of interest policy is available on request.
Past performance is not necessarily a guide to the future. The value of investments can fall as well as rise and you may get back less than you invested when you decide to sell your investments. It is strongly recommended that Independent financial advice should be taken before entering into any financial transaction.
PLEASE SEE ALSO OUR TERMS AND CONDITIONS
Kepler Partners LLP is a limited liability partnership registered in England and Wales at 9/10 Savile Row, London W1S 3PF with registered number OC334771.
Kepler Partners LLP is authorised and regulated by the Financial Conduct Authority.
These articles are provided for information purposes only. Occasionally, an opinion about whether to buy or sell a specific investment may be provided by third parties. The content is not intended to be a personal recommendation to buy or sell any financial instrument or product, or to adopt any investment strategy as it is not provided based on an assessment of your investing knowledge and experience, your financial situation or your investment objectives. The value of your investments, and the income derived from them, may go down as well as up. You may not get back all the money that you invest. The investments referred to in this article may not be suitable for all investors, and if in doubt, an investor should seek advice from a qualified investment adviser.
Full performance can be found on the company or index summary page on the interactive investor website. Simply click on the company's or index name highlighted in the article.