Stockwatch: do this chart and results indicate a new uptrend?
He caught this share just as it began to turn higher. Now sitting on double-digit gains, analyst Edmond Jackson updates his view after latest figures and some new information.
25th August 2026 11:45
by Edmond Jackson from interactive investor

With no sign of any truce between the US and Iran, emergency reserves of crude oil running down and a revision of the UK energy price cap due tomorrow from Ofgem, is the late-summer macro context ripening in favour of renewables shares?
- Invest with ii: Invest in Investment Trusts | Top UK Shares| Interactive investor Offers
Higher electricity prices – whether by demand or greater cost of oil – benefit renewables as shown by recently strong first-half 2026 results. I am interested to re-examine Greencoat UK Wind (LSE:UKW), a £2.4 billion renewable infrastructure investment trust that is a UK-listed leader in wind farms, owning investments in some 40 onshore and nine offshore, with total generating capacity of 1,942 megawatts (MW).
Last March, I made a “buy” case at 96p after the chart had shown a four-year downtrend from 190p and key valuation criteria looked appealing - 0.72x underlying net asset value (NAV) of 133p per share, a 12-month forward price/earnings (PE) ratio around 7.2x, and an 11.2% prospective yield with earnings cover above 1.2x.
The yield seemed particularly attractive, with a valuation anomaly that should correct (for share price upside) given 59% of discounted cash flows had been fixed over the next seven years, providing a useful compromise of surety but also exposure to higher energy prices.
The dividend is also linked to UK consumer price inflation (CPI) and, despite a decline in financial performance since 2022, the company has managed to raise its payout over 13 years.
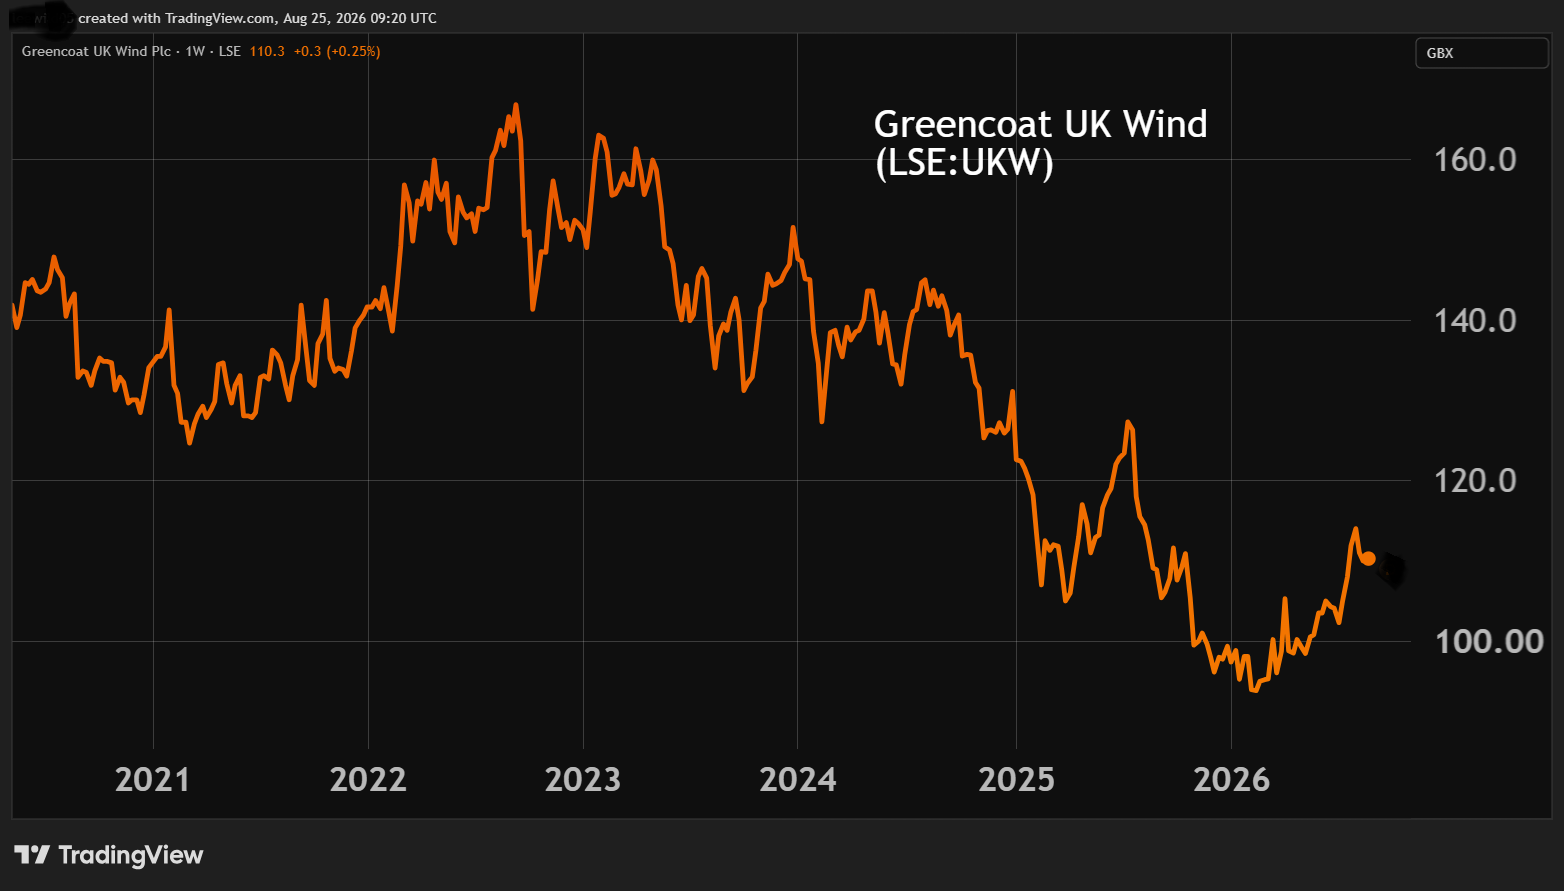
Source: TradingView. Past performance is not a guide to future performance.
Consensus looks for an 11.2p per share dividend in 2027 with 1.1x earnings cover, implying a still highly attractive 10.2% yield at 110p – especially relative to industry cyclicals should high energy prices finally crimp the global economy.
The chart still makes it look hard to be sure that a four-year downtrend is assuredly broken. A rally from 102p on 10 July to 116p on 5 August covered the 30 July interim results period, hence can be seen as anticipation and consideration thereof.
Greencoat UK Wind - financial summary
Year-end 30 Dec
| 2020 | 2021 | 2022 | 2023 | 2024 | 2025 | |
| Turnover (£m) | 155 | 423 | 1,025 | 234 | 61.7 | -45.4 |
| Operating margin (%) | 81.3 | 93.0 | 96.2 | 82.8 | 38.3 | 0.0 |
| Operating profit (£m) | 126 | 394 | 987 | 194 | 23.6 | -74.3 |
| Net profit (£m) | 104 | 363 | 954 | 126 | -55.4 | -193 |
| Reported earnings/share (p) | 6.5 | 18.3 | 41.2 | 5.4 | -2.4 | -8.7 |
| Normalised earnings/share (p) | 6.5 | 18.3 | 41.2 | 5.4 | -2.4 | -8.7 |
| Operating cashflow/share (p) | 7.7 | 12.2 | 23.6 | 15.5 | 17.1 | 16.5 |
| Capital expenditure/share (p) | 0.0 | 0.0 | 0.0 | 0.0 | 0.0 | 0.0 |
| Free cashflow/share (p) | 7.7 | 12.2 | 23.6 | 15.5 | 17.1 | 16.5 |
| Dividend/share (p) | 7.1 | 7.2 | 7.7 | 10.0 | 10.0 | 10.4 |
| Return on capital (%) | 3.8 | 9.7 | 20.5 | 3.8 | 0.5 | -1.7 |
| Cash (£m) | 7.9 | 4.8 | 19.8 | 21.8 | 5.8 | 14.2 |
| Net debt (£m) | 1,092 | 945 | 1,081 | 1,768 | 1,754 | 1,706 |
| Net assets/share (p) | 122 | 134 | 167 | 164 | 151 | 133 |
Source: company accounts.
Strong first-half numbers
The comprehensive income statement on 30 July needed some unpacking but came across overall strongly.
Investment income rose 16.4% to £252.2 million which, on a reduced negative movement in the fair value of investments (£76.8 million vs £206.6 million), left the combined value at £178.1 million, up sharply on £12.8 million in first-half 2025. Such “negative movement” relates to lower forecast power prices, subdued wind resource and interest/discount rate shifts, the combined effect of which has improved relatively.
Operating expenses 14% lower at £12.8 million also helped operating profit rebound from a £2.5 million loss to £164.5 million profit.
Finance expenses of £45.1 million eased 8.5% but still took a material 27.4% of operating profit. At 30 June, there was £1.6 billion net debt (down from £1.7 billion), intentionally to maximise returns and fund infrastructure rather than dilute shareholders, hence net gearing of 56.0%.
Net movement on interest rate swaps (fluctuations in yield curves and interest rates) then influenced pre-tax profit positively by £7.8 million versus a £20.6 million hit in first-half 2025.
It made for an income statement good in parts, if impacted by finance costs and their variability. Interim basic diluted earnings per share (EPS) recovered from a 3.2p loss to 5.9p, and a 5.36p interim dividend was declared. The target for total 2026 dividend remains 10.7p per share, which would be a 13th consecutive inflation-linked increase.
- Is a revival on the cards for these high-yielding trusts?
- Ian Cowie: four trusts to tap into ‘quietest bull market on earth’
Generation rose 17% to 2,567 gigawatts (GWh), 4.9% above budget, with favourable power prices helping as UK wind speeds were only 1% above long-term averages. This looks a key portent for the rest of the year and into 2027 if power prices edge higher with no real resolution in the Middle East. It’s very similar to whether one opts to fix one’s domestic energy price contract right now.
It drove a 36% increase in net cash generation to £222 million, putting guidance for full-year net cash generation towards the top end of a £350-410 million range, another promising portent and one which enhanced net asset value (NAV) marginally by 0.7p to 134.1p per share.
However, Greencoat’s share price discount to NAV still “does not in the board’s view reflect the strength of the business” and “persists mainly due to macroeconomic and sector-wide pressures, including higher interest rates, policy uncertainty and an oversupply of listed renewable infrastructure vehicles”. Some of these pressures were said to be easing, notably shrinkage of the listed renewable trust sector.
Even so, share buybacks had next to no priority, probably because gearing is already high and the board wants to prioritise a 13-year record of dividend increases, which is appealing to income investors.
Management proclaimed it was entering the second half of the year with positive momentum, the outlook for UK wind remaining attractive as electricity demand continues to rise and the UK becomes more reliant on domestic renewable energy.
Elephant in the room
The market reaction to Greencoat’s interim results implied a continuation of the share’s uptrend with a 10p blip up, although the 5p slip back to 110p may reflect some remaining scepticism.
Does this chiefly relate to government subsidies? How significant are they, and are they a cause for reassurance or concern? In key respects I should have better engaged this when drawing attention to renewables shares last March, even though it appears the piece was well-timed versus chart lows.
Greencoat’s recent “comprehensive” income statement made no mention of such. There was a detailed appraisal of power prices, but even notes showing the constituents of NAV included 10 references such as inflation at £36.7 million and refinancing costs at £3.4 million, as if any subsidies were buried within £221.6 million net cash generation. Yet note 17 to the cash flow statement chiefly mentions operating profit and movement in fair value of investments.
This doesn’t square with at least three indicators that subsidies are involved.
MP Claire Coutinho has criticised Parliament’s Climate Change Committee (CCC) and the government for severe underestimation and lack of transparency regarding offshore wind and renewable energy subsidies.
A critique on online publishing platform Substack entitled “Greencoat Flapping in the Wind” and published last October (I was unaware of this in March) claimed that the strength of the dividend record chiefly relates to subsidies.
It said: “Six of the offshore wind farms are subsidised under the Renewables Obligation Certificate (ROC) scheme and two under Contracts for Difference (CfD). Almost all the onshore wind farms are covered by the ROC scheme, although some operate without any subsidy and one is subsidised through CfDs. Total subsidies where Greencoat has a stake were cited over £8.7 billion over their lives. Many of these farms also receive constraint payments such as when turbines get turned off when there is more wind power [than] the grid can handle; these amounting over £350 million according to the Renewable Energy Foundation.”
A search affirms that Greencoat benefits significantly from government-backed, inflation-linked subsidies, with around 65% of revenue deriving from subsidies and fixed contracts, and 35% exposed to open market prices.
- Insider: has this senior FTSE 100 director spotted a bargain?
- Sign up to our free newsletter for investment ideas, latest news and award-winning analysis
The share’s de-rating from 2022 can therefore be seen in part to be reflecting concern about how ROC subsidies average around seven years left, with approximately half the farms’ lifetime cash flows becoming exposed to wholesale power prices.
While I do not currently withdraw a “buy” stance, its shares need to be regarded like an option in the absence of better clarification in Greencoat’s reporting in the sense that the current payout policy has an expiry date, or at least a de-rating of the dividend in a worst-case scenario.
It seems possible that an element of subsidy persists, especially under a future left-leaning progressive government – say Labour in coalition with the Greens – which currently seems more likely than the dislocated right wing in British politics supporting each other.
So, the long-term “buy” case here is a lot more nebulous than my reading in March, and I’m surprised the listing rules do not appear to require genuine disclosure.
Otherwise, on a one-year view, the chart is evolving a nice “bowl” pattern – for what this alleged bullish technical indicator is worth.
Edmond Jackson is a freelance contributor and not a direct employee of interactive investor.
These articles are provided for information purposes only. Occasionally, an opinion about whether to buy or sell a specific investment may be provided by third parties. The content is not intended to be a personal recommendation to buy or sell any financial instrument or product, or to adopt any investment strategy as it is not provided based on an assessment of your investing knowledge and experience, your financial situation or your investment objectives. The value of your investments, and the income derived from them, may go down as well as up. You may not get back all the money that you invest. The investments referred to in this article may not be suitable for all investors, and if in doubt, an investor should seek advice from a qualified investment adviser.
Full performance can be found on the company or index summary page on the interactive investor website. Simply click on the company's or index name highlighted in the article.
Disclosure
We use a combination of fundamental and technical analysis in forming our view as to the valuation and prospects of an investment. Where relevant we have set out those particular matters we think are important in the above article, but further detail can be found here.
Please note that our article on this investment should not be considered to be a regular publication.
Details of all recommendations issued by ii during the previous 12-month period can be found here.
ii adheres to a strict code of conduct. Contributors may hold shares or have other interests in companies included in these portfolios, which could create a conflict of interests. Contributors intending to write about any financial instruments in which they have an interest are required to disclose such interest to ii and in the article itself. ii will at all times consider whether such interest impairs the objectivity of the recommendation.
In addition, individuals involved in the production of investment articles are subject to a personal account dealing restriction, which prevents them from placing a transaction in the specified instrument(s) for a period before and for five working days after such publication. This is to avoid personal interests conflicting with the interests of the recipients of those investment articles.