Stockwatch: why I like these two renewable infrastructure funds
After significant share price declines in recent years, and with energy prices volatile, analyst Edmond Jackson believes there’s an opportunity here.
10th March 2026 12:20
by Edmond Jackson from interactive investor

Amid a big sell-off it is often interesting to see which shares resist or even climb. Renewables infrastructure investment trusts have been in a bear market since late summer 2022 as a boon from Russia’s invasion of Ukraine was replaced by higher interest rates to tackle inflation.
- Invest with ii: Open a Stocks & Shares ISA | What is a Stocks & Shares ISA? | ISA Offers & Cashback
Some such funds had borrowed to expand their asset bases – wind farms, solar panels and the like –whose operational stories also became mixed, the ethical appeal of eco investment replaced by lack of wind or blue sky.
It was all enough to see renewables funds slump to a discount to net asset value (NAV) of 34% in February. Within their 2025 results presentations, both the Renewables Infrastructure Group (LSE:TRIG) and Greencoat UK Wind (LSE:UKW) were able to reassure the market against ongoing NAV erosion after the numbers posted further declines, hence shares began ticking up.
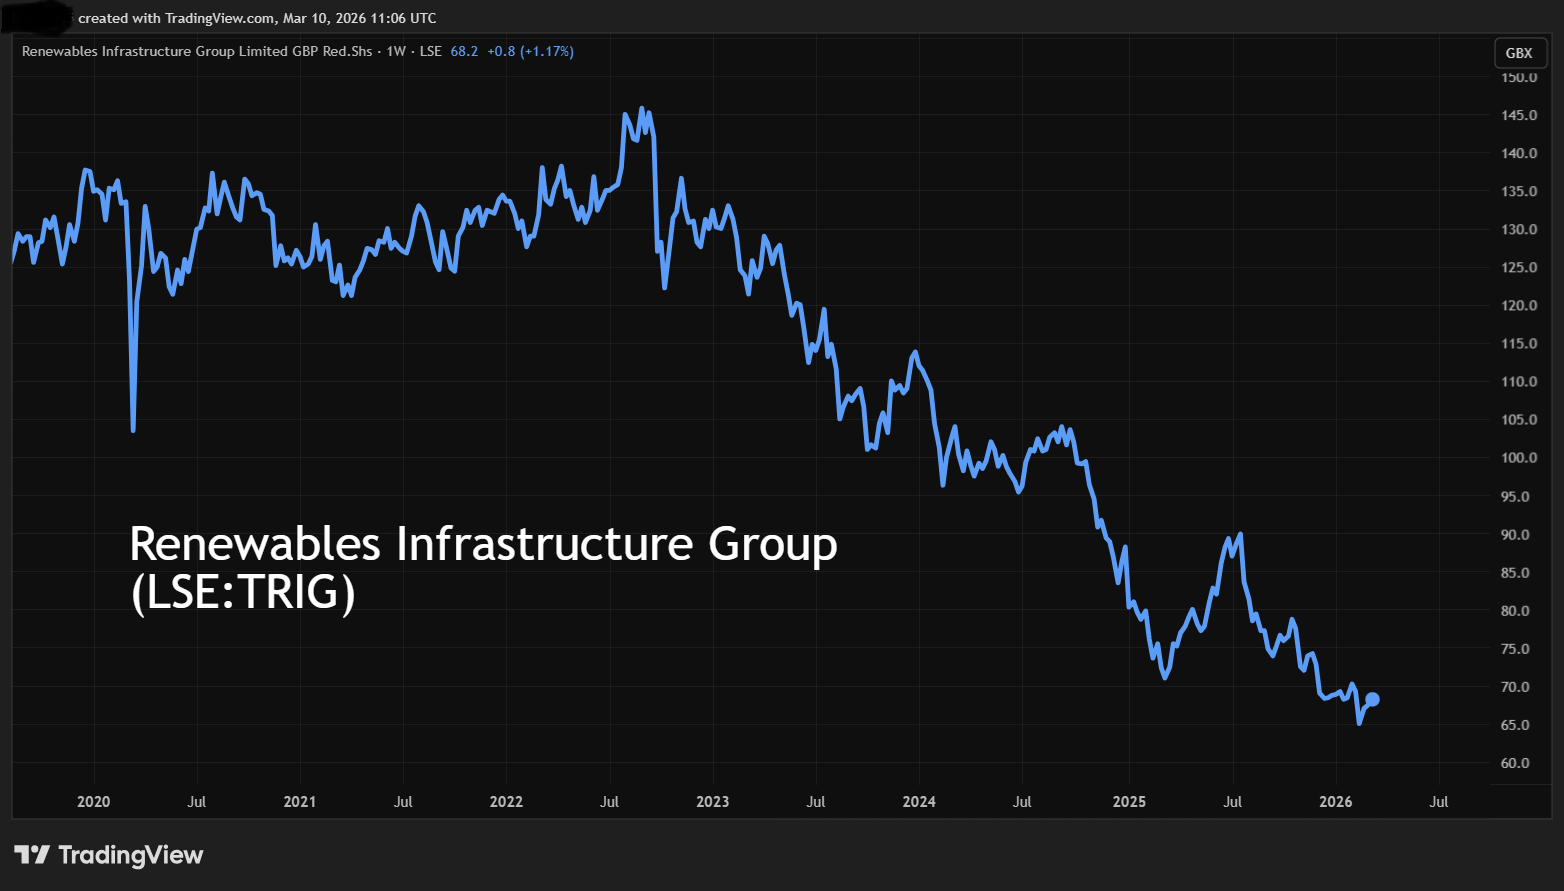
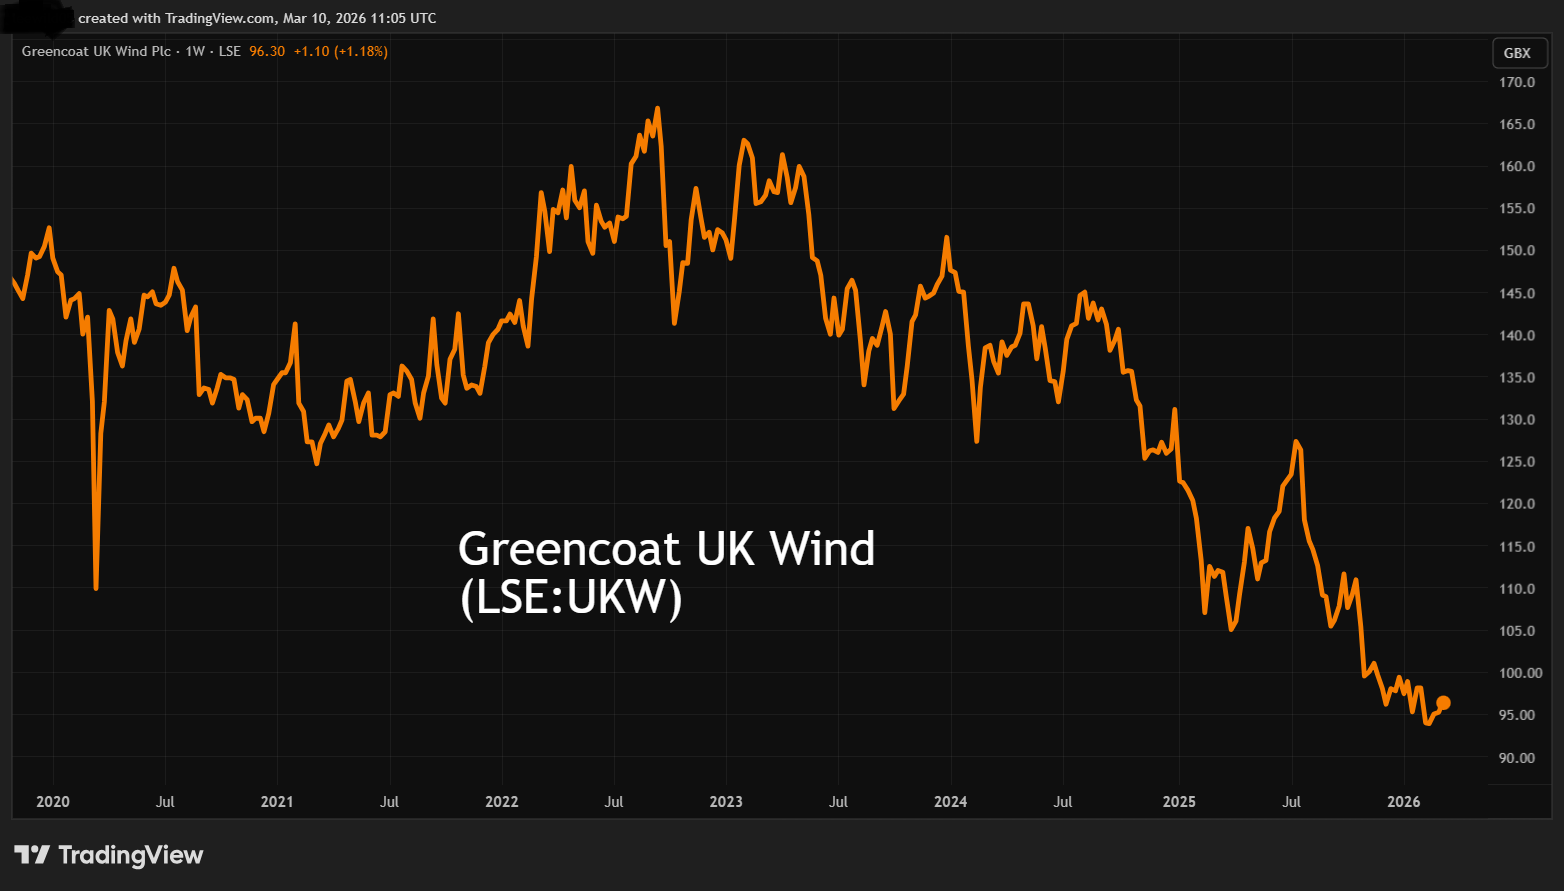
Source: TradingView. Past performance is not a guide to future performance.
Soaring oil & gas prices – especially if sustained – will raise electricity prices, rekindling appeal for broader sources given around 30% is currently derived from natural gas. Even in the years running up to the Ukraine crisis, such funds traded at modest premiums to NAV, so conceptually there is scope for some mean reversion upwards.
Moreover, European Union energy demand returned to growth in 2025 for the first time since 2017 and electricity demand is forecast to rise around 2% a year to 2030. The UK saw a second consecutive year of power demand growth and the fastest annual growth for the first time in over two decades. Obviously, a hard recession would disrupt that.
Fears about how the narrative on interest rates will reverse from steady cuts possibly even to increases if inflation becomes entrenched, implies that care is required in stock selection, in this case as to which funds carry material debt.
Such variables – key to future performance – are obviously tricky to gauge right now. There is no historic precedent of air strikes alone achieving regime change, but without such change in Iran, its new leader – who has just lost his closest family members in the bombing of the Ayatollah’s compound – seems even less likely to find compromise with the US and Israel.
- What would a longer war in the Middle East mean for investors?
- Buying British: dividends, defence and diversification
It seems likely, once US President Donald Trump realises the mire he has got himself into with his electorate – stocks falling and energy prices soaring – he will spin some kind of “victory” and retreat from Gulf action. The tipping point will be if and when Iranian drone strikes fizzle out, enabling UAE refineries to restart production.
But it would also need to involve free passage of the Strait of Hormuz where Iranian proxies can enact a longer-term threat. I don’t share the oil market’s knee-jerk reaction back from well over $100 a barrel to $90 on the basis of Trump’s reassuring words from his Florida retreat, that this war will be over soon.
If the Iranian regime remains intact, then more likely this episode will have inflamed acrimony in the Arab/Israeli conflict and with the US. The reason Japanese equities plunged last Monday was reliance on the Middle East for 90% of Japan’s oil imports.
I am therefore wary how, in the medium term, Trump’s mercurial irresponsibility is liable to leave an even worse mess than George W. Bush and Tony Blair did in Iraq. From a tactical investment view, it is worth considering options at least to hedge by way of exposure to energy. My last two pieces engaged five oil & gas shares. Now, I look at two renewable funds.
- Stockwatch: should investors back these four oil stocks?
- Stockwatch: is this share an emerging global oil & gas major?
The Renewables Infrastructure Group is a prime candidate
TRIG floated in July 2013 at 100p per share, reaching 145p in mid-2022, but has seen a near consistent downtrend thereafter to a 64p February low. It is capitalised at £1.6 billion, with a diversified portfolio of infrastructure, spanning wind, solar and battery storage projects across six European markets.
At 67p, its shares trade at 0.64x net tangible asset value and offer a remarkable 11.5% dividend yield, albeit marginally short of earnings cover based on 2026 and 2027 consensus earnings forecasts. However, the 2025 results showed operational cash flow which covered the dividend 2.1x gross and 1.0x net after £192 million debt repayment; cash flow being what really matters for payouts.
The Renewables Infrastructure Group - financial summary
Year-end 30 Dec
| 2020 | 2021 | 2022 | 2023 | 2024 | 2025 | |
| Turnover (£m) | 119 | 175 | 555 | -24.2 | -158.0 | -104.0 |
| Operating margin (%) | 98.5 | 98.9 | 99.6 | 0.0 | 0.0 | 0.0 |
| Operating profit (£m) | 117 | 173 | 553 | -27.6 | -161 | -111 |
| Net profit (£m) | 100 | 210 | 521 | 5.8 | -115 | -130 |
| Reported earnings/share (p) | 5.8 | 10.0 | 21.5 | 0.2 | -4.7 | -5.4 |
| Normalised earnings/share (p) | 5.8 | 10.0 | 21.5 | 0.2 | -4.7 | -5.4 |
| Operating cashflow/share (p) | 6.7 | 7.4 | 7.9 | 5.4 | 5.3 | 5.0 |
| Capital expenditure/share (p) | 0.0 | 0.0 | 0.0 | 0.0 | 0.0 | 0.0 |
| Free cashflow/share (p) | 6.7 | 7.4 | 7.9 | 5.4 | 5.3 | 5.0 |
| Dividend/share (p) | 6.7 | 6.8 | 6.8 | 7.2 | 7.5 | 7.6 |
| Return on capital (%) | 5.4 | 6.4 | 16.5 | -0.9 | -5.6 | -4.4 |
| Cash (£m) | 23.1 | 28.2 | 24.5 | 18.1 | 11.7 | 7.1 |
| Net debt (£m) | -23.1 | -28.2 | -24.5 | -18.1 | -11.7 | -7.1 |
| Net assets/share (p) | 115 | 119 | 135 | 128 | 116 | 104 |
Source: company accounts.
The end-2025 balance sheet was also clear of debt, leaving £7.1 million cash.
While the company notionally was loss-making at the operating and net levels, the income statement – where you usually would see revenue - showed a £213 million “net loss on investments” reduced from a £276 million deficit in 2024. Mind you, this does represent what could be a nadir in energy pricing alongside low winds achieved.
For what the consensus expectation is worth, £187 million net profit is pencilled in for 2026 and 2027, with buybacks enhancing earnings per share (EPS) from 6.9p to 7.7p, giving a 12-month forward price/earnings (PE) ratio of 9.5x. If energy prices remain elevated, then upgrades look likely. This applies also to NAV, which fell 11.9p to 104.0p per share due to lower power price forecasts and winds.
Complicating forecasts, however, is 75% of revenues being fixed over the next five years, diluting the effect of price rises. Yet it was possible to consider renewables shares had fallen to overly big discounts to NAV and fat yields, before war in Iran kicked off.
TRIG has also suffered a disappointment lately after HICL Infrastructure PLC Ord (LSE:HICL) shareholders failed to approve a merger in December, which would have created synergies and de-risked the dividend. It created an onus for TRIG to justify itself again as a standalone.
Greencoat UK Wind: the listed leader in wind farms
This fund floated in mid-2013 at 100p per share, reaching 165p in September 2022 and, similar to TRIG, trading at a modest premium to NAV until mid-2022. But NAV fell by 12% last year to 133p per share, hence a current market price of 96p implying 0.72x.
Reported losses also relate similarly to lower gas prices affecting power price forecasts. I suggest they should now be improving intrinsically even if numbers are yet to.
- Fund Focus: what the Iran conflict means for your portfolio
- Where investment professionals are investing their ISA
Greencoat’s 2025 income statement still shows stable investment income of £395 million before a £446 million movement in fair value of investments. Lower down is £94 million of finance expense on £1.7 billion net debt, extending the net loss to £193 million.
Capitalised at £2.1 billion, the shares offer an 11.2% prospective yield where indeed there is expected earnings cover over 1.2x and the 12-month forward PE looks around 7.2x – with upgrades seemingly likely.
Greencoat UK Wind - financial summary
Year-end 30 Dec
| 2020 | 2021 | 2022 | 2023 | 2024 | 2025 | |
| Turnover (£m) | 155 | 423 | 1,025 | 234 | 61.7 | -45.4 |
| Operating margin (%) | 81.3 | 93.0 | 96.2 | 82.8 | 38.3 | 0.0 |
| Operating profit (£m) | 126 | 394 | 987 | 194 | 23.6 | -74.3 |
| Net profit (£m) | 104 | 363 | 954 | 126 | -55.4 | -193 |
| Reported earnings/share (p) | 6.5 | 18.3 | 41.2 | 5.4 | -2.4 | -8.7 |
| Normalised earnings/share (p) | 6.5 | 18.3 | 41.2 | 5.4 | -2.4 | -8.7 |
| Operating cashflow/share (p) | 7.7 | 12.2 | 23.6 | 15.5 | 17.1 | 16.5 |
| Capital expenditure/share (p) | 0.0 | 0.0 | 0.0 | 0.0 | 0.0 | 0.0 |
| Free cashflow/share (p) | 7.7 | 12.2 | 23.6 | 15.5 | 17.1 | 16.5 |
| Dividend/share (p) | 7.1 | 7.2 | 7.7 | 10.0 | 10.0 | 10.4 |
| Return on capital (%) | 3.8 | 9.7 | 20.5 | 3.8 | 0.5 | -1.7 |
| Cash (£m) | 7.9 | 4.8 | 19.8 | 21.8 | 5.8 | 14.2 |
| Net debt (£m) | 1,092 | 945 | 1,081 | 1,768 | 1,754 | 1,706 |
| Net assets/share (p) | 122 | 134 | 167 | 164 | 151 | 133 |
Source: company accounts.
As for hedging, Greencoat has fixed 59% of its discounted cash flows over the next seven years, hence has potentially better exposure to higher electricity prices than TRIG. This is also to link dividend policy to consumer price inflation (CPI).
While net cash from operations eased 7% to £365 million, disposals worth £103 million more than doubled cash flow on the investing side of the fund’s flow statement to near £111 million. This helped buybacks rise 35% to £108 million relative to £227 million as dividends.
Management expects to have around £1 billion capital from organic excess cash flow to allocate over the next five years towards development objectives. Opportunities are anticipated from secondary sales of renewables also new construction. As yet, Greencoat has just a 6% UK market share.
‘Buy’ stances look justified
I cite these two funds as exemplary, although you might want to read further around this sector. It is the case that I was already considering such shares before this war on Iran erupted, and I believe higher energy prices are likely to feature in 2026 unless regime change leads to oil sanctions lifting.
- The trusts five investors at Kepler are choosing for their ISAs
- Sector Screener: two stocks to consider amid market turmoil
A longer-term risk could be a Reform government abandoning net zero and pivoting towards North Sea development. Yet I believe a mixed UK energy policy is most likely to remain. Wind actually generated close to 30% of UK electricity in 2025, and last January saw an allocation round for offshore wind offering 20-year contracts linked to CPI.
Growth in data centres is expected to raise UK electricity demand by around 15% over the next five years, yet production from nuclear and gas is expected to decline over the next decade as plants retire.
I therefore consider the odds now tilt towards “buy”.
Edmond Jackson is a freelance contributor and not a direct employee of interactive investor.
These articles are provided for information purposes only. Occasionally, an opinion about whether to buy or sell a specific investment may be provided by third parties. The content is not intended to be a personal recommendation to buy or sell any financial instrument or product, or to adopt any investment strategy as it is not provided based on an assessment of your investing knowledge and experience, your financial situation or your investment objectives. The value of your investments, and the income derived from them, may go down as well as up. You may not get back all the money that you invest. The investments referred to in this article may not be suitable for all investors, and if in doubt, an investor should seek advice from a qualified investment adviser.
Full performance can be found on the company or index summary page on the interactive investor website. Simply click on the company's or index name highlighted in the article.
Disclosure
We use a combination of fundamental and technical analysis in forming our view as to the valuation and prospects of an investment. Where relevant we have set out those particular matters we think are important in the above article, but further detail can be found here.
Please note that our article on this investment should not be considered to be a regular publication.
Details of all recommendations issued by ii during the previous 12-month period can be found here.
ii adheres to a strict code of conduct. Contributors may hold shares or have other interests in companies included in these portfolios, which could create a conflict of interests. Contributors intending to write about any financial instruments in which they have an interest are required to disclose such interest to ii and in the article itself. ii will at all times consider whether such interest impairs the objectivity of the recommendation.
In addition, individuals involved in the production of investment articles are subject to a personal account dealing restriction, which prevents them from placing a transaction in the specified instrument(s) for a period before and for five working days after such publication. This is to avoid personal interests conflicting with the interests of the recipients of those investment articles.