Have defensive trusts delivered decent returns?
A Kepler study examines how the performance of cautiously managed investment trusts over the past five years might inform how you invest over the next five.
12th June 2026 14:35

This content is provided by Kepler Trust Intelligence, an investment trust focused website for private and professional investors. Kepler Trust Intelligence is a third-party supplier and not part of interactive investor. It is provided for information only and does not constitute a personal recommendation.
Material produced by Kepler Trust Intelligence should be considered a marketing communication, and is not independent research.
The Austrian Habsburg monarchy is often associated with the Latin saying “Bella gerant alii, tu felix Austria nube”, which can be translated as “Let others wage war; you, fortunate Austria, marry”.
This maxim reflects the Habsburgs’ skill in expanding their power through strategic marriages rather than military conquests. Although less dramatic, this approach arguably entailed lower risks than territorial expansion through war, which inherently carries the possibility of catastrophic outcomes.
Moreover, the Habsburgs’ strategy proved remarkably successful. At their peak, the dynasty controlled, among others, the Holy Roman Empire, the Low Countries, and Spain (together with its vast overseas empire), across different branches of the family.
Inspired by the success of the Habsburgs’ lower-risk approach to territorial expansion, we asked whether a lower-risk approach could have been successful in equity markets over the past five years, a period long enough to capture a range of different market environments.
To explore this, we identified the investment trusts with the lowest beta (a measure of an asset’s sensitivity to market movements) in key equity sectors within the Association of Investment Companies (AIC) universe. We then analysed where more defensive profiles have worked best, and where they have struggled.
Finally, we constructed a portfolio of these low-beta investment trusts, analysed its performance against the MSCI ACWI, and considered what its performance might tell us about how to invest over the next five years.
Fortunes and setbacks
The Habsburgs’ ‘marriage strategy’ achieved notable successes, most prominently the union of Maximilian I with Mary of Burgundy, which secured control of the Low Countries, while their son married Joanna of Castile, expanding the dynasty’s influence in Spain. However, their approach also faced setbacks, such as in England, where negotiations for a potential marriage between Queen Elizabeth I and the archduke of Austria ultimately collapsed. Similarly, lower-beta strategies have experienced success in some regions but setbacks in others over the past five years.
The AIC Europe sector is one area where the constituent with the lowest beta, JPMorgan European Growth & Income Ord (LSE:JEGI), was the strongest performer, while also outperforming the regional benchmark. However, we note that JEGI’s beta is not particularly low in absolute terms, at 1.03, meaning it is broadly at the same level as the market. We think the higher betas of its sector peers stem from their tilt towards growth stocks, which tend to be more sensitive to market movements, whereas JEGI’s managers aim to maintain a balance across investment factors. This diversification across factors has played a crucial role in JEGI’s outperformance. For example, the inclusion of the value factor has enabled the managers to include European banks in the portfolio and benefit from their rally. In contrast, JEGI’s growth- and quality-growth-tilted peers have tended to have low or even no exposure to this part of the market. Moreover, some sector constituents have run with high levels of gearing over the period under review, which has increased their market exposure.
The table below shows the five-year beta of all constituents of the AIC Europe sector. Note that European Opportunities Trust (LSE:EOT)has achieved a slightly lower beta than JEGI; however, it has had a high allocation to UK equities over the period, and we have treated the domestic market as a separate region. In addition, it is worth noting that the board of EOT has proposed to shareholders a rollover option into either JEGI or the LT European Opportunities fund (LEO), or alternatively an uncapped cash exit option, with the scheme expected to complete in August 2026.
BETA IN THE AIC EUROPE SECTOR
| Constituent | Beta | Outperformance/underperformance of MSCI Europe ex UK over five years (%) |
| European Opportunities Trust (LSE:EOT) | 1 | -35.7 |
| Fidelity European Trust Ord (LSE:FEV) | 1.03 | 26.6 |
| Fidelity European Trust Ord (LSE:FEV) | 1.04 | -3.3 |
| BlackRock Greater Europe Ord (LSE:BRGE) | 1.2 | -44.6 |
| Baillie Gifford European Growth Ord (LSE:BGEU) | 1.28 | -78.1 |
Source: Morningstar, for the five years to 29/05/2026. Past performance is not a reliable indicator of future results
Similarly, in Japan, the trust with the lowest beta, CC Japan Income & Growth Ord (LSE:CCJI), has also been the sector’s best performer. Its beta for the five-year period is 1.08, which compares with a simple average of 1.14 for the AIC Japan sector. Like JEGI, CCJI is an income-focused strategy, but unlike the European trust, it pays a natural dividend.
As such, the bulk of its portfolio is typically invested in high-quality companies with the capacity to grow their dividends consistently, which tend to be lower-beta stocks. However, CCJI has maintained high levels of gearing over the past five years, averaging c. 19.2%, which has brought its beta slightly above the market level. Ungeared, CCJI’s portfolio has a beta well below one. In contrast, the other sector constituents do not have an income mandate. Moreover, they tend to invest in growth or quality-growth names, or to have significant exposure to small- and mid-cap stocks, areas of the market where equities tend to have higher betas.
In terms of performance, CCJI has benefited from a combination of strong stock selection and structural tailwinds supportive of its approach, such as ongoing corporate governance reforms in Japan aimed at improving shareholder returns (including through higher dividends) and a rising interest rate environment, rewarding its exposure to bank stocks. At times, the trust has struggled relative to its benchmark and growth-oriented peers, notably in periods when market returns were driven by AI-related stocks. However, this has not prevented CCJI from outperforming the TOPIX index and its sector average in each calendar year since 2021, as the bar chart below shows.
CALENDAR-YEAR RETURNS
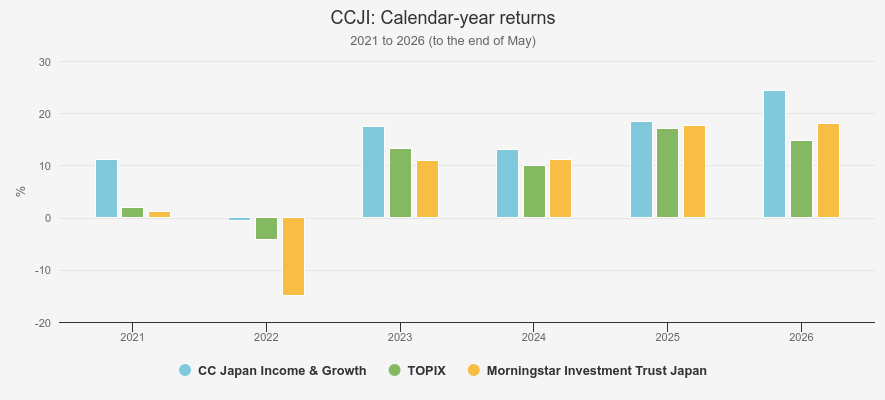
Source: Morningstar. Past performance is not a reliable indicator of future results
Finally, JPMorgan Emerging Markets Div Inc (LSE:JEMI), the lowest-beta constituent in the AIC Global Emerging Markets sector, has also outperformed its regional benchmark over the period under review. While JEMI also pays a natural income, meaning its portfolio is skewed towards dividend-paying stocks, manager Omar Naygal also has the flexibility to invest c. 20% of the portfolio in lower-yielding stocks with higher growth potential, enabling the trust to capture some upside in growth-driven market environments. As such, the trust has been able to benefit from the strong performance of semiconductor companies like Taiwan Semiconductor Manufacturing Co Ltd ADR (NYSE:TSM) and Samsung Electronics Co Ltd DR (LSE:SMSN). However, Templeton Emerging Markets (TEM) and Fidelity Emerging Markets Ord (LSE:FEML), the two constituents with the highest betas, outperformed the MSCI EM Index by an even larger margin, having benefited from their greater exposure to semiconductor-related names such as Taiwan Semiconductor Manufacturing and SK Hynix, as well as, in the case of FEML, off-benchmark mining companies such as Pan African Resources (LSE:PAF).
It is worth noting that some constituents of the AIC Emerging Markets sector have achieved even lower betas relative to the MSCI EM Index than JEMI. However, we have assessed that they are not fully representative of the emerging markets universe due to their specialist nature or focus on frontier markets, which constitute a distinct asset class. For example, Utilico Emerging Markets Ord (LSE:UEM)focuses on infrastructure and utilities, whileMobius Investment Trust Ord (LSE:MMIT) invests in small- and mid-cap companies. Meanwhile, BlackRock Frontiers Ord (LSE:BRFI)specialises in smaller emerging and frontier markets, differing materially from the MSCI EM Index, while Barings Emerging EMEA Opportunities Ord (LSE:BEMO)and JPMorgan Emerg EMEA Sec Plc (LSE:JEMA) focus on the EMEA region.
BETA IN THE AIC GLOBAL EMERGING MARKETS SECTOR
| Constituent | Beta | Outperformance/underperformance of MSCI EM over five years (%) |
| Utilico Emerging Markets Ord (LSE:UEM) | 0.51 | 2.2 |
| BlackRock Frontiers Ord (LSE:BRFI) | 0.51 | -35.4 |
| JPMorgan Emerg EMEA Sec Plc (LSE:JEMA) | 0.61 | -30 |
| Barings Emerging EMEA Opportunities Ord (LSE:BEMO) | 0.64 | -19.4 |
| Mobius Investment Trust Ord (LSE:MMIT) | 0.76 | -20.4 |
| JPMorgan Emerging Markets Div Inc (LSE:JEMI) | 0.91 | -2.5 |
| JPMorgan Emerging Markets Growth & Inc (LSE:JMGI) | 0.92 | -9.1 |
| Fidelity Emerging Markets Ord (LSE:FEML) | 0.96 | 69.5 |
| Templeton Emerging Markets (NYSE:EMF) | 1.12 | 55.3 |
Source: Morningstar, for the five years to 29/05/2026. Past performance is not a reliable indicator of future results.
Conversely, the AIC North America sector is an area where the lowest-beta strategy,North American Income Trust Ord (LSE:NAIT), has not succeeded in outperforming the regional benchmark, the S&P 500. That said, it is worth noting that the trust measures its performance against the Russell 1000 Value Index, a US value benchmark, which it has outperformed.
NAIT’s low beta of 0.80 (relative to the S&P 500) is explained by its focus on dividend-paying stocks, with the trust paying a natural income. However, returns in the US equity market over the past five years have been dominated by higher-beta technology stocks, such as NVIDIA Corp (NASDAQ:NVDA) and Broadcom Inc (NASDAQ:AVGO), which have benefited from the AI boom. These companies typically pay low or no dividends and are therefore difficult to reconcile with NAIT’s investment objective. However, we note that a high-beta approach has not necessarily delivered superior returns. For instance, Baillie Gifford US Growth Ord (LSE:USA), the sector constituent with the highest beta, has lagged the S&P 500 Index by a larger margin than NAIT. This highlights how concentrated market returns in the US have been over the period under review.
The table below shows the beta and outperformance/underperformance relative to the S&P 500 Index over five years for all constituents of the AIC North America sector, excluding Canadian General Investment (CGI), a Canadian specialist. Note that we have applied a slightly different methodology for this sector, calculating betas on a monthly basis to account for the fact that Pershing Square Holdings Ord (LSE:PSH) does not publish its NAV daily.
BETA IN THE AIC NORTH AMERICA SECTOR
| Constituent | Beta | Performance/underperformance of S&P 500 over five years (%) |
| North American Income Trust Ord (LSE:NAIT) | 0.8 | -37.1 |
| BlackRock American Income Trust Ord (LSE:BRAI) | 0.83 | -29.6 |
| Pershing Square Holdings Ord (LSE:PSH) | 0.96 | -25 |
| JPMorgan American Ord (LSE:JAM) | 1.02 | -2.9 |
| Baillie Gifford US Growth Ord (LSE:USA) | 1.11 | -87.4 |
Source: Morningstar, for the five years to 29/05/2026. Past performance is not a reliable indicator of future results
In the domestic market as well, the lowest-beta strategy, Finsbury Growth & Income Ord (LSE:FGT), has struggled to keep up with the FTSE All Share. FGT’s low beta can be explained by a historically cautious use of gearing, combined with manager Nick Train’s focus on high-quality companies with strong competitive advantages and a track record of consistently generating high returns on capital. However, these companies have been out of favour over most of the period under review, with market returns having been driven by cyclical businesses that Nick typically avoids. That has included banks, mining, oil, and defence-related names, which tend to have higher betas than the stocks Nick typically holds. That said, we note that investment trusts with the highest betas across the AIC UK All Companies and UK Equity Income sectors have also failed to outperform the FTSE All-Share Index. Many of these trusts exhibit a bias towards growth-oriented small- and mid-cap stocks, which have also been out of favour over the past five years.
Building the empire
Having identified the lowest-beta constituents across the major equity-focused AIC sectors, we can now construct a portfolio and assess how it would have performed against the MSCI ACWI over the past five years, a period long enough to encompass a range of different market environments.
We allocated to each investment trust a weight corresponding to its region’s weight in the MSCI ACWI as at 31 May 2021. However, we incorporated smaller regions within broader categories where there was only one, or no, dedicated investment trust covering them. For example, we included the Middle East and Australasia within emerging markets, and Canada within North America.
Finally, we assumed that the portfolio was never rebalanced, allowing regional weights to rise or fall naturally over time, as they would in a conventional market-capitalisation-weighted equity index.
PORTFOLIO WEIGHTS
| Investment trust | Allocated regions | Weight (%) |
| North American Income Trust | United States, Canada | 60.9 |
| JPMorgan Emerging Markets Dividend Income | Asia - Emerging, Asia – Developed, Latin America, Australasia, Middle East, Europe – Emerging, Africa | 16.4 |
| JPMorgan European Growth & Income | Europe ex-Euro, Eurozone | 13 |
| CC Japan Income & Growth | Japan | 6 |
| Finsbury Growth & Income | UK | 3.7 |
Source: Morningstar, Kepler calculations
This resulted in a portfolio that delivered a NAV total return of 72.1%, which compares with 81.4% for the MSCI ACWI. Given the weight of US equities in the portfolio and their dominance in global market returns over the period, the performance of the North American representative was crucial to the portfolio’s overall relative return. However, as discussed above, NAIT struggled to keep pace with the S&P 500 Index in a market environment dominated by a narrow cohort of AI-related stocks, particularly semiconductor companies. While JEGI and CCJI both significantly outperformed their regional benchmarks as well as the MSCI ACWI, this was not sufficient to offset the drag from the North American allocation.
FIVE-YEAR PERFORMANCE
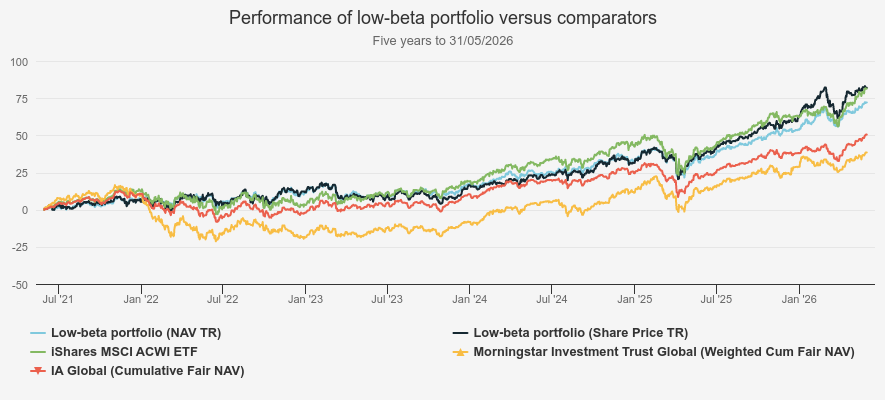
Source: Morningstar. Past performance is not a reliable indicator of future results
That said, on a share price basis, the portfolio delivered a total return of 82%, marginally ahead of the MSCI ACWI, and more representative of investors’ experience. This reflects the fact that several trusts in the portfolio have seen their discounts narrow over the period under review, resulting in stronger share price than NAV total returns. In our view, this highlights one of the advantages of the investment trust structure: investors can benefit not only from the performance of the underlying assets, but also from a potential rerating of the trust’s shares. For example, NAIT’s discount narrowed from 9.2% to 5.1% in the five years to the end of May 2026. As a result, the gap between its share price total return of 81.6% and the S&P 500 Index’s return of 100% was narrower than with its NAV total return of 70.4%.
DISCOUNT
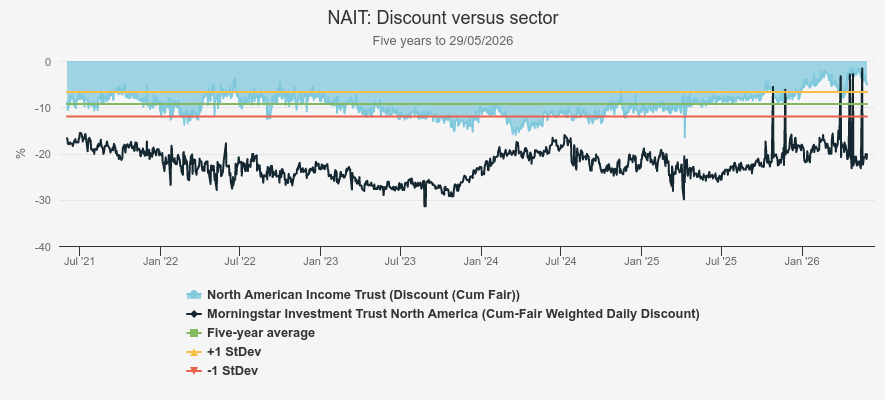
Source: Morningstar
JEGI’s discount has narrowed even more significantly over the same period, moving close to par, from 10% to 0.7%. In fact, most of the narrowing occurred in 2025, coinciding with renewed investor interest in European equities, also potentially reflecting its strong performance relative to both its regional benchmark and sector peers.
DISCOUNT
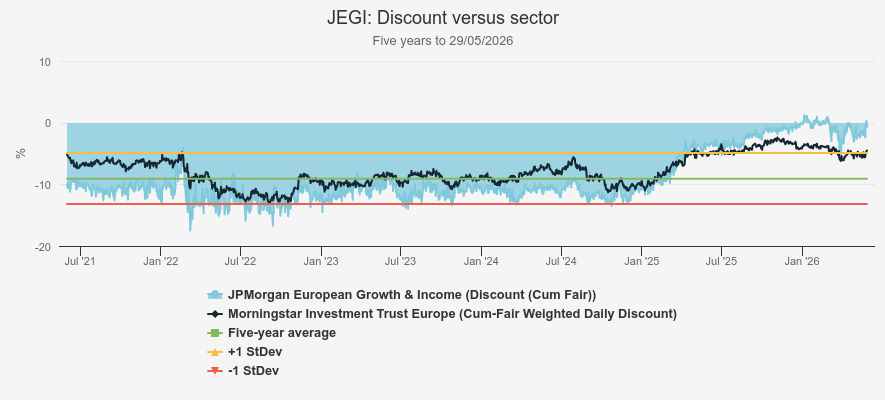
Source: Morningstar
Conclusion
In spite of the successes of their marriage politics, the Habsburgs’ approach ceased to work in the 19th century when they were challenged by rivals more inclined to expand their power through military campaigns, notably Napoleonic France and Prussia. Military defeats against the former led to the dissolution of the Holy Roman Empire in 1806, which the Habsburgs had dominated for centuries, while defeats against the latter in 1866 led to Austria’s exclusion from the German Confederation, with the centre of power in Central Europe shifting from Vienna to Berlin.
Similarly, the past five years have, overall, not been rewarding for a low-beta approach to global equity markets. This is because market returns have been concentrated in higher-beta technology stocks, particularly those linked to AI, since the initial release of ChatGPT in late 2022. This pattern has been particularly pronounced in North America, by far the largest regional component of global equity indices, and in emerging markets.
Companies such as NVIDIA and Broadcom in North America and Taiwan Semiconductor Manufacturing and SK Hynix in emerging markets have dominated market returns. Even in Europe, where AI-related opportunities are less abundant, ASML was the best-performing stock over the period, although financials were the strongest-performing sector overall. Similarly, in Japan, financials were the best-performing sector, but AI-related stocks such as SoftBank and Tokyo Electron were still among the market’s top performers. The UK was an exception, where AI-related opportunities in public markets are scarce.
That said, we note that in absolute terms, low-beta strategies have still delivered decent returns. Notably, in regions where the dominance of AI-related stocks has been the most pronounced, like North America and emerging markets, NAIT and JEMI both delivered NAV total returns of c. 70% amid a period that was not rewarding for their approach. In addition, we think the dominance of high-beta AI-related stocks could be fragile. For one, they are now trading on high valuations, reflecting high expectations from investors. As such, if they fail or are too slow to deliver an adequate return, the market may punish them severely.
In addition, the war in Iran and the blockade of the Strait of Hormuz have caused an energy price shock that could affect the AI trade. As training and running large models are energy-intensive activities, hyperscalers and companies embedded in the AI supply chain may see an impact on their operating costs. Moreover, it could also cause a market rotation into energy and defensive sectors, which could play into the hands of equity income strategies like NAIT. As such, the market environment in the next five years might be more conducive to a low-beta approach.
Kepler Partners is a third-party supplier and not part of interactive investor. Neither Kepler Partners or interactive investor will be responsible for any losses that may be incurred as a result of a trading idea.
These articles are provided for information purposes only. Occasionally, an opinion about whether to buy or sell a specific investment may be provided by third parties. The content is not intended to be a personal recommendation to buy or sell any financial instrument or product, or to adopt any investment strategy as it is not provided based on an assessment of your investing knowledge and experience, your financial situation or your investment objectives. The value of your investments, and the income derived from them, may go down as well as up. You may not get back all the money that you invest. The investments referred to in this article may not be suitable for all investors, and if in doubt, an investor should seek advice from a qualified investment adviser.
Full performance can be found on the company or index summary page on the interactive investor website. Simply click on the company's or index name highlighted in the article.
Important Information
Kepler Partners is not authorised to make recommendations to Retail Clients. This report is based on factual information only, and is solely for information purposes only and any views contained in it must not be construed as investment or tax advice or a recommendation to buy, sell or take any action in relation to any investment.
This report has been issued by Kepler Partners LLP solely for information purposes only and the views contained in it must not be construed as investment or tax advice or a recommendation to buy, sell or take any action in relation to any investment. If you are unclear about any of the information on this website or its suitability for you, please contact your financial or tax adviser, or an independent financial or tax adviser before making any investment or financial decisions.
The information provided on this website is not intended for distribution to, or use by, any person or entity in any jurisdiction or country where such distribution or use would be contrary to law or regulation or which would subject Kepler Partners LLP to any registration requirement within such jurisdiction or country. Persons who access this information are required to inform themselves and to comply with any such restrictions. In particular, this website is exclusively for non-US Persons. The information in this website is not for distribution to and does not constitute an offer to sell or the solicitation of any offer to buy any securities in the United States of America to or for the benefit of US Persons.
This is a marketing document, should be considered non-independent research and is subject to the rules in COBS 12.3 relating to such research. It has not been prepared in accordance with legal requirements designed to promote the independence of investment research.
No representation or warranty, express or implied, is given by any person as to the accuracy or completeness of the information and no responsibility or liability is accepted for the accuracy or sufficiency of any of the information, for any errors, omissions or misstatements, negligent or otherwise. Any views and opinions, whilst given in good faith, are subject to change without notice.
This is not an official confirmation of terms and is not to be taken as advice to take any action in relation to any investment mentioned herein. Any prices or quotations contained herein are indicative only.
Kepler Partners LLP (including its partners, employees and representatives) or a connected person may have positions in or options on the securities detailed in this report, and may buy, sell or offer to purchase or sell such securities from time to time, but will at all times be subject to restrictions imposed by the firm's internal rules. A copy of the firm's conflict of interest policy is available on request.
Past performance is not necessarily a guide to the future. The value of investments can fall as well as rise and you may get back less than you invested when you decide to sell your investments. It is strongly recommended that Independent financial advice should be taken before entering into any financial transaction.
PLEASE SEE ALSO OUR TERMS AND CONDITIONS
Kepler Partners LLP is a limited liability partnership registered in England and Wales at 9/10 Savile Row, London W1S 3PF with registered number OC334771.
Kepler Partners LLP is authorised and regulated by the Financial Conduct Authority.