Stockwatch: buy Alphabet’s crash or chase Microsoft’s momentum?
Six months after Bill Ackman’s brilliantly timed tech trade, analyst Edmond Jackson reveals which of these two titans he’d rather own in the months ahead.
30th October 2026 12:26
by Edmond Jackson from interactive investor

Alphabet’s Google logo with a Microsoft logo in the background. Photo: Pavlo Gonchar/SOPA Images/LightRocket via Getty Images.
In May, I compared Google parent Alphabet Inc Class A (NASDAQ:GOOGL) and Microsoft Corp (NASDAQ:MSFT). I was prompted by Berkshire Hathaway Inc Class B (NYSE:BRK.B) more than tripling its stake in Alphabet, making this its seventh-largest equity holding. It was, however, effectively buying from Bill Ackman’s Pershing Square Holdings Ord (LSE:PSH) investment company, which sold down a successful Alphabet exposure to switch into Microsoft.
- Invest with ii: Buy US Stocks from UK | Most-traded US Stocks | Cashback Offers
Six months later, it is interesting to re-assess both companies after third-quarter earnings reports, and also whether share price performance reveals if Berkshire’s newish CEO post-Warren Buffett is on the ball – or if we should pay more attention to Ackman.
I concluded cautiously on both shares given a 30x trailing price/earnings (PE) ratio for Alphabet at $379 and 25x for Microsoft at $419 with only a sub-0.9% yield. But macro events concerned me, particularly that should the Middle East war become protracted, and inflation/interest rates rise, growth multiples would be especially risky for buyers.
On the other hand, I said, “should the US and Iran reach a broadly satisfactory settlement then global tech probably would join a relief rally”. Unfortunately, that scenario now looks dashed as a war of attrition sets in, although such is the growth at Microsoft especially, no wonder investors are paying attention.
I defend my macro caution by noting how despite Microsoft’s stonking third-quarter results, in a weaker wider market the initial 4% pop higher faded to just 0.8% overnight, with the shares on 27x expected earnings and a 0.9% yield.
Biggest-ever drop in Alphabet shares Thursday
Since May, Alphabet is down 25% including yesterday’s plunge of 13% to $282 after third-quarter results missed expectations in some respects. I think it necessary to stand back and try to get a longer-term perspective, rather than the American market mentality that has a quarterly reporting focus, and tech analysts are prone to get hung up on specific issues.
Google Cloud revenue more than doubled to about $31 billion and the Gemini app passed one billion users. However, search revenue growth of 12% to $63 billion was short of $65 billion consensus, and Alphabet’s net cash outflow was over $9 billion amid higher spending on AI infrastructure and data centres.
Yet this outflow is a blip relative to $265 billion cash and marketable securities on the 30 September balance sheet. It’s hardly as if Alphabet faces any kind of liquidity risk.
Alphabet Inc - segmental analysis
| Quarter ended 30 September | ||
| Revenue: $ millions | 2025 | 2026 |
| Google Search & other | 56,567 | 63,350 |
| YouTube ads | 10,261 | 11,207 |
| Google Network | 7,354 | 7,455 |
| Google advertising | 74,182 | 82,012 |
| Google subscriptions, platforms & devices | 12,870 | 14,290 |
| Google Services total | 87,052 | 96,302 |
| Google Cloud | 15,157 | 30,709 |
| Other bets | 344 | 372 |
| Hedging gains/losses | -207 | 194 |
| Total revenue | 102,346 | 127,577 |
| Traffic acquisition costs | 14,876 | 16,366 |
| Number of employees | 190,167 | 204,757 |
| Operating income: | ||
| Google Services | 33,527 | 39,157 |
| Google Cloud | 3,594 | 11,121 |
| Other bets | -1,426 | -2,047 |
| Corporate costs | -4,467 | -7,655 |
| Total income from operations | 31,228 | 40,576 |
Source: third fiscal quarter release.
It strikes me that the share plunge marks a general change in sentiment towards AI. In the early stages of a tech boom, shares rally when losses are declared because everyone is bullish about proceeds to come from investment. Now the market is putting a more traditional emphasis on operating numbers declared.
You can argue that the Google business is still fundamentally a growth one; that numbers were not quite as great as expected due to foreign exchange headwinds, tough comparators and huge investment currently. Critics, however, say that Google’s search engine is being “dis-intermediated”, with AI cutting out the middleman so there are fewer paid links when you ask a bot questions. This has been Google’s bread and butter, with the implication that search is decelerating and near-term margins have peaked.
- 10 of the biggest IPOs on Wall Street in 2026
- Polar Capital Technology: the AI stocks I’m excited about in cognitive era
It looks to me as if such an existential question for Google will take months or longer to assess and decide whether such change is transitory or structural. Until confirmed, the shares could therefore trade volatile-sideways until we get clarity, especially if the trend in interest rates is tightening.
Otherwise, and in five-year context, the volatility since last November can be seen as near-term noise within a broadly upward trend:
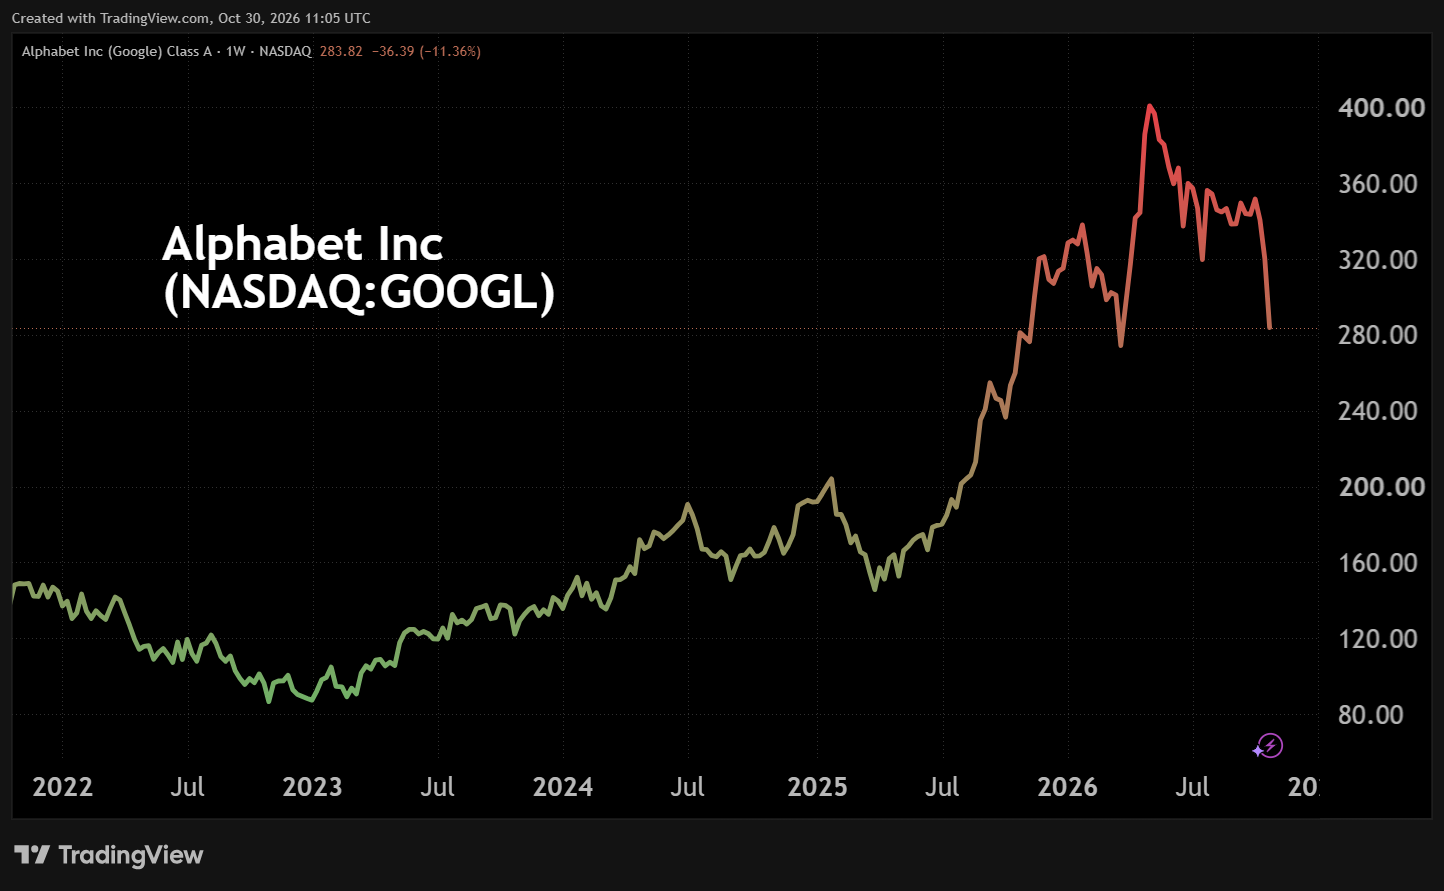
Source: TradingView. Past performance is not a guide to future performance.
A near-term valuation dilemma for sentiment is the forward PE being around 21x versus 17x trailing, reflecting an aspect of earnings deceleration. Some would say this is early stage, others that it reflects investment and near-term issues. Within such consensus, one research house contends that a 14x PE and hugely attractive PEG ratio (PE-Growth) of 0.13x (where value theoretically lies sub-1.0x).
The contrarian inside me likes to think about counter mob sentiment, which social psychologists would say will fluctuate anyway and, given a half-decent market, Alphabet will rally again.
From a trading angle, there’s possibly an argument for buying now, but on an investment view the case for Alphabet is disrupted, and rising interest rates would not help. The shares seem in that awkward fudge of a “hold” stance pending further evidence.
Microsoft is a booming comparator
Ackman has appeared to make a master stroke this year, switching from Alphabet to Microsoft like he did. Third-quarter calendar results – Microsoft’s first quarter for the 30 September fiscal year – show group revenue up 19% to $92.3 billion, within which Cloud as the 69% contributor saw 30% growth to $63.9 billion renting computer power and AI tools to other companies. Cloud platform Azure’s cloud services soared 48%, ahead of internal targets of up to 45%.
- ii view: Microsoft makes strong start to fiscal year
- Sign up to our free newsletter for investment ideas, latest news and award-winning analysis
In response to “revenue is vanity, profit sanity”, Microsoft net income is up 23% to $31.8 billion – beating expectations, as did revenue – versus Alphabet down 25% to $26.2 billion.
Microsoft Corporation
Segmental product & service revenues with constant currency reconciliation
$ million
| % Change yr on yr | Constant currency | % Change at c/c | |
| Commercial remaining performance obligation | 73% | 0% | 73% |
| Microsoft Cloud revenue | 30% | 1% | 31% |
| Azure revenue | 48% | 0% | 48% |
| Microsoft 365 commercial cloud revenue | 17% | 1% | 18% |
| Microsoft 365 consumer cloud revenue | 17% | -1% | 16% |
| Industry solutions cloud revenue | 10% | 0% | 10% |
| Search and advertising revenue | 12% | 0% | 12% |
| XBOX content & services revenue | -2% | 1% | -1% |
| Windows OEM and devices revenue | -22% | 0% | -22% |
Source: first fiscal quarter release.
My macroeconomic concern is, however, supported in the way that, despite Microsoft beating expectations and initially opening up 4% at 550p, it closed slightly easier at $530 then lost $4 overnight. Amazon.com Inc (NASDAQ:AMZN) fell double-digits per cent in 24 hours though.
Is it possible to discern sufficient intrinsic value within Microsoft operations to offset what could be a macro headwind for the shares? They already enjoy a premium 27x PE – both trailing and prospective – relative to a US software sector median around 17x. Against this, the consensus earnings growth rate in the current fiscal year is about 14%, rising to 20% in the year to September 2028. In strict arithmetic terms, it’s overvalued, and one should not pay a material premium for qualitative factors such as Microsoft’s scale, its cloud growth via Azure and AI infrastructure demand.
I suspect this dilemma helps explain why Microsoft’s chart has actually been more volatile than Alphabet’s in the last two years, which in theory reduces the PE multiple for higher risk:
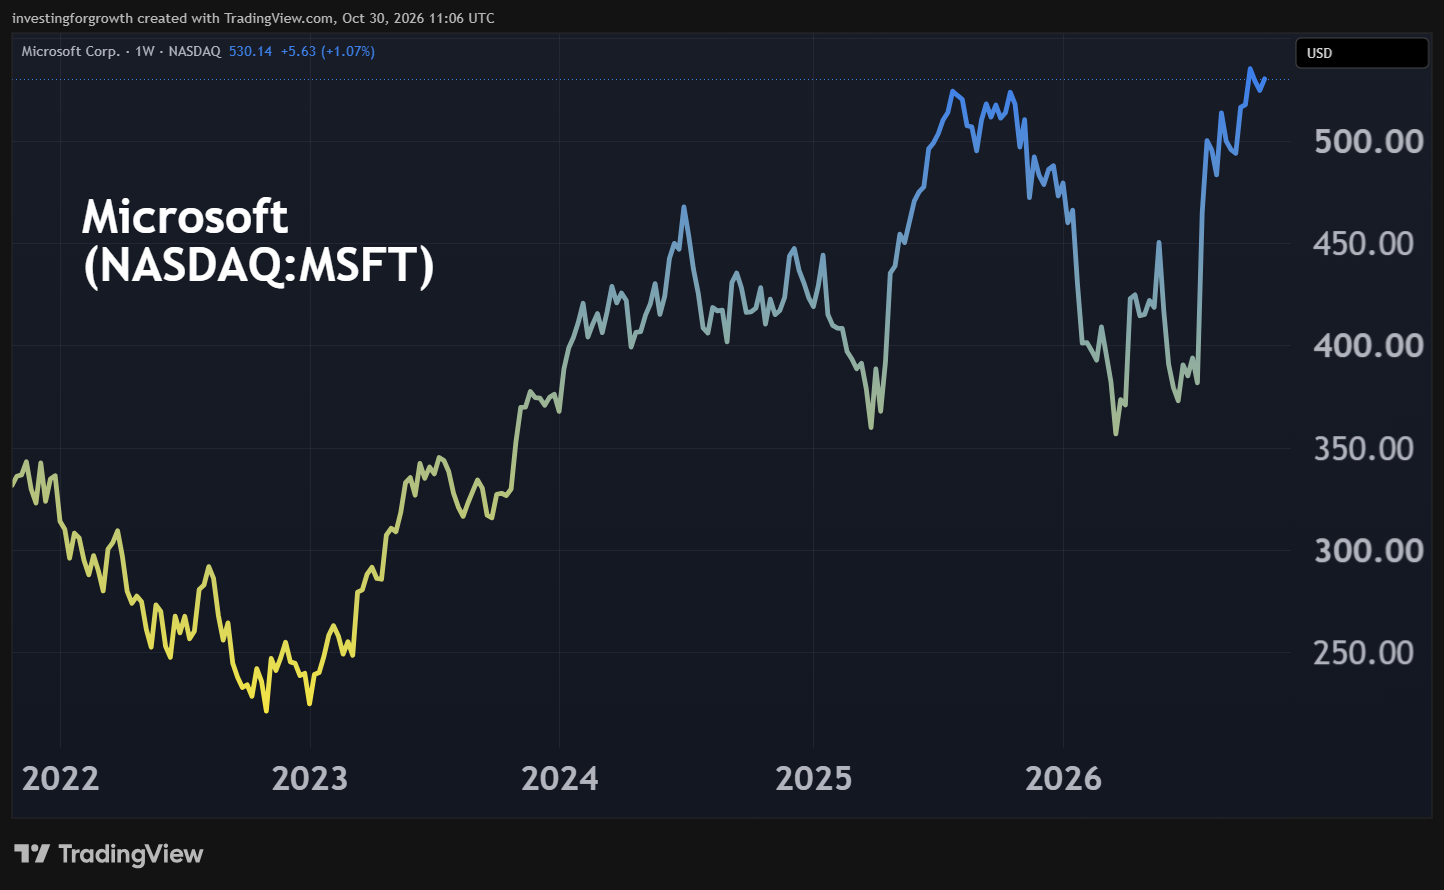
Source: TradingView. Past performance is not a guide to future performance.
Essentially this reflects a tug-of-war between believers in AI infrastructure spending and investor anxiety about when such investments will pay out. For its latest quarter, Microsoft cites $45 billion capital expenditure chiefly tied to NVIDIA Corp (NASDAQ:NVDA) graphics processing units (GPUs) and Intel Corp (NASDAQ:INTC)/Advanced Micro Devices Inc (NASDAQ:AMD) central processing units (CPUs) alongside data centre memory. Capacity needs scaling up to meet growth in demand for Azure and AI agents such as Foundry and 365 Copilot.
Total capex in the 2026 calendar year is being guided around $170 billion and over $50 billion in the current quarter, and in the earnings call the finance director guided for revenue of $96-97 billion, above expectations albeit operating margins will be slightly down year-on-year.
Call me cautious, but I do note how despite various beats in this release, Microsoft shares essentially are flat in response – admittedly in a weak macro context. That’s not to imply that they are “priced for perfection” but, in the short term at least, buyers are tiring when market price fails to materially respond. It affirms a sense that the valuation is high enough; a “hold” rather than “buy”.
I still would be more confident owning Microsoft than Alphabet in the months ahead, given its substance as a conviction play on transformational AI – which I believe is far-reaching despite some bubble aspects.
Edmond Jackson is a freelance contributor and not a direct employee of interactive investor.
These articles are provided for information purposes only. Occasionally, an opinion about whether to buy or sell a specific investment may be provided by third parties. The content is not intended to be a personal recommendation to buy or sell any financial instrument or product, or to adopt any investment strategy as it is not provided based on an assessment of your investing knowledge and experience, your financial situation or your investment objectives. The value of your investments, and the income derived from them, may go down as well as up. You may not get back all the money that you invest. The investments referred to in this article may not be suitable for all investors, and if in doubt, an investor should seek advice from a qualified investment adviser.
Full performance can be found on the company or index summary page on the interactive investor website. Simply click on the company's or index name highlighted in the article.
Disclosure
We use a combination of fundamental and technical analysis in forming our view as to the valuation and prospects of an investment. Where relevant we have set out those particular matters we think are important in the above article, but further detail can be found here.
Please note that our article on this investment should not be considered to be a regular publication.
Details of all recommendations issued by ii during the previous 12-month period can be found here.
ii adheres to a strict code of conduct. Contributors may hold shares or have other interests in companies included in these portfolios, which could create a conflict of interests. Contributors intending to write about any financial instruments in which they have an interest are required to disclose such interest to ii and in the article itself. ii will at all times consider whether such interest impairs the objectivity of the recommendation.
In addition, individuals involved in the production of investment articles are subject to a personal account dealing restriction, which prevents them from placing a transaction in the specified instrument(s) for a period before and for five working days after such publication. This is to avoid personal interests conflicting with the interests of the recipients of those investment articles.