The income trusts bringing cash back home
A Kepler analyst looks at UK equity income managers quietly selling overseas holdings and returning to their home market, and asks: where's the money going?
13th November 2026 14:00

This content is provided by Kepler Trust Intelligence, an investment trust focused website for private and professional investors. Kepler Trust Intelligence is a third-party supplier and not part of interactive investor. It is provided for information only and does not constitute a personal recommendation.
Material produced by Kepler Trust Intelligence should be considered a marketing communication, and is not independent research.
Thirty years ago this Christmas, Britain sat down to watch Del Boy and Rodney Trotter finally strike it rich. After decades of dodgy deals and doomed ventures, their fortune had been sitting in the garage all along: a dusty old watch that proved to be a lost Harrison timepiece, sold at Sotheby’s for £6.2 million. Del Boy had looked everywhere for the next big thing, except under his own nose.
It’s hard not to see a little of the Trotters in the way British investors treat their own stock market. For the best part of a decade, the UK has been the junk at the back of the lock-up, stuffed with old-economy banks, miners, oil majors and tobacco companies nobody wants to be seen with at a dinner party. The money went chasing shinier opportunities abroad, above all the US tech giants, some of which, to be fair, have delivered exceptional results. And with a revolving door at Downing Street, stubborn inflation and a market written off as the Jurassic Park of global equities, we Brits have had no shortage of material for talking ourselves down.
But here’s the twist that would make even Del Boy do a double take. From the start of 2025 to the end of September 2026, the FTSE All-Share delivered a total return of 36%, comfortably ahead of the S&P 500’s 25%, as the chart below shows. Much of that came from an exceptional 2025, the FTSE 100’s best year since 2009, before the index broke through 10,000 for the first time in January 2026. The so-called dinosaurs did the heavy lifting, with banks, gold miners and defence names such as Rolls-Royce Holdings (LSE:RR.) and Babcock International Group (LSE:BAB) leading the way, while a weaker dollar took some of the shine off US returns.
UK VERSUS US
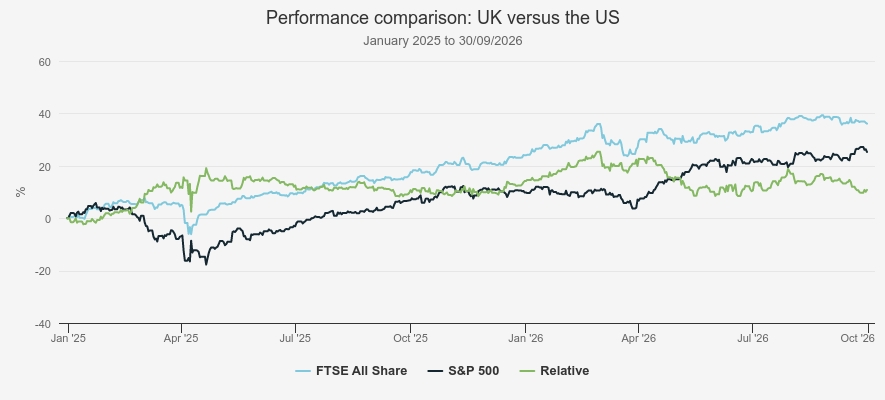
Source: Morningstar. Past performance is not a reliable indicator of future results
Yet you’d struggle to know it. Investors keep pulling their money out, commentators still file the UK under boring and ex-growth, and the market trades at a discount to most of its peers. Switch on the news, try to book a GP appointment or wince at the weekly shop, and it’s easy to see why so few Brits want to back their own market. But how Britain feels and the opportunity in its stock market are two different things, and for investors that gap is where the opportunity lies.
From conversations with equity income fund managers in recent weeks we have been struck by how many have been selling their overseas holdings and repatriating cash. This looks like a real trend, and one which is at odds with the headlines and the relentless selling by retail. Have the professionals spotted a Harrison at the back of the garage?
Feet planted on home soil
You’d be forgiven for assuming that a UK equity income trust, benchmarked against the FTSE All-Share, invests only in British companies. In fact, many can invest a portion overseas, most commonly up to 20%. Managers have often used that freedom to add something the UK market can’t offer, whether a business with no real domestic equivalent, a global leader facing little competition, or a way to diversify away from a handful of dominant UK names. Lately though, the managers have been slashing their overseas exposure and bringing cash back home. This has been a common theme in a number of conversations we have had with managers recently, but naturally, we ran the numbers.
We compared each trust’s current overseas exposure with the figures in its last three annual reports and, as the chart below shows, the direction of travel is clear. Across the 16 trusts, average overseas exposure has fallen from 9.5% to 5.4%, eight are at their lowest level of the period and none has added more than a percentage point. Among the six trusts where the move has been sharpest, the average has dropped from 12.9% to just 3.9%. Temple Bar Ord (LSE:TMPL)and Dunedin Income Growth Ord (LSE:DIG)remain the outliers, each still holding a fifth or more overseas, though even they hold less abroad than three years ago.
UK EQUITY INCOME OVERSEAS EXPOSURE
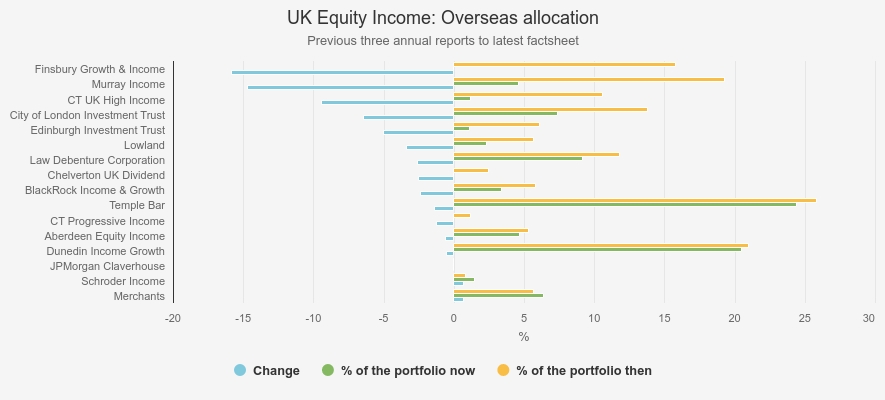
Source: Morningstar, Kepler calculations
Why does this matter? The managers spend their days comparing British companies with their overseas rivals, so when many are reaching the same conclusion, we think it’s a signal worth paying attention to, particularly when almost everyone else is heading the other way.
The biggest move in our search has come from Finsbury Growth & Income Ord (LSE:FGT). Three annual reports ago (FY 2023), almost 16% of the portfolio sat overseas, in businesses such as Mondelez International Inc Class A (NASDAQ:MDLZ), Heineken NV (EURONEXT:HEIA) and Remy Cointreau (EURONEXT:RCO). Today, it is zero. Manager Nick Train still rates them as high-calibre companies with strong brands, but in his view their growth prospects were neither as well established nor as attractively priced as those in the UK. Despite the board raising its overseas limit to 30% in 2018, FGT is now invested entirely at home.
Edinburgh Investment Ord (LSE:EDIN) tells a similar story, with overseas exposure down from around 6% to just 1% and only a single US holding left. Imran Sattar noted this is one of the lowest levels over his career, reflecting what he sees as a strong supply of attractively priced stocks at home. And at CT UK High Income Ord (LSE:CHI), the fall has been sharper still, from more than 10% to around 1%. David Moss sold his European holdings in favour of what he sees as better value at home and, in his view, the UK is cheap against both its own history and international peers, a gap that shows up company by company, with recent addition Aviva trading at a large discount to its European rivals.
Murray Income Trust Ord (LSE:MUT) has seen the biggest fall after FGT, from around 19% to under 5%, driven by Artemis taking over as manager in March and reshaping around three-quarters of the portfolio. The new team will still look abroad, but only for something no UK-listed company can offer, such as Spanish group Ebro Foods SA (XMAD:EBRO), the world’s largest rice producer, rather than diversifying for its own sake. Instead, much of the money has gone into UK domestic banks, with NatWest Group (LSE:NWG), Lloyds Banking Group (LSE:LLOY) and Barclays (LSE:BARC) now among the largest holdings, which the managers see as good value, well capitalised and dependably cash generative. They also see opportunity in Diageo (LSE:DGE), whose shares are as cheap as they’ve been since the financial crisis, and view this year’s bids for Segro (LSE:SGRO) and easyJet (LSE:EZJ) as evidence of undervaluation.
City of London Ord (LSE:CTY)has made a more gradual shift, roughly halving its overseas exposure from around 14% to 7%. Job Curtis and David Smith believe there is huge value on offer and the UK’s valuation gap is exactly what international buyers are tapping into, with Beazley (LSE:BEZ) and Tate & Lyle (LSE:TATE) among several holdings bid for in the year to June. And with around 59% of CTY’s underlying revenues coming from overseas, London-listed multinationals offer global earnings at UK prices, making the overseas equivalent harder to justify.
Beyond UK equity income, most UK All Companies and UK Smaller Companies trusts hold little or nothing overseas, with Fidelity Special Values Ord (LSE:FSV), at around 17%, and BlackRock Smaller Companies Ord (LSE:BRSC), at around 7%, the notable exceptions. Neither sector shows a clear trend, which makes the shift among the income trusts more interesting.
The natural next question is where the money is going, and three themes recur. The first is data. RELX (LSE:REL), London Stock Exchange Group (LSE:LSEG) and Experian (LSE:EXPN) have been sold off on fears that AI will erode their businesses, with RELX falling by double digits in a single day when Anthropic launched an AI legal tool in February. CTY, CHI, EDIN and DIG have all been buying. The managers’ view is that the market has lumped these companies in with AI’s losers when they are better placed to be winners.
AI is only as good as the information it works with, and these businesses own vast, constantly refreshed datasets, from legal records to market prices and credit histories, that AI developers can’t simply scrape from the internet. Their customers are lawyers, lenders and traders, who can’t afford a wrong answer and whose regulators demand accuracy and an audit trail. Rather than being bypassed, these companies are building AI into the tools their customers already use, and in LSEG’s case supplying the data that third-party AI tools draw on.
The second is the domestic economy. Banks, housebuilders, REITs and construction companies feature heavily among recent additions, particularly at CTY, MUT and EDIN, reflecting low valuations and the improving backdrop described earlier, with housebuilders also in line for a potential lift from the Budget’s first-time buyer scheme.
The third is mid-caps. Home to many of the UK’s most domestically focussed businesses, the FTSE 250 has borne the brunt of the market’s unpopularity, and EDIN and DIG have both been buying. Bidders have noticed too, with EDIN’s Imran noting that around 10% of mid-caps have received bids over the past year, at an average premium of 30%. For investors, that’s a useful combination: the part of the market with the most to gain if the domestic recovery holds, and a steady stream of bids to unlock value if it takes longer.
TMPL is the genuine exception. Ian Lance and Nick Purves run a value strategy that follows the cheapest assets wherever they are, and five of their seven new holdings in the first half of 2026 were overseas, including US food groups The Kraft Heinz Co (NYSE:KHC) and JM Smucker Co (NYSE:SJM), bought on around 10 times earnings. For a £1.3 billion trust, the shrinking UK market is also a practical constraint, as takeovers leave fewer companies large enough to make a difference, and the board may propose lifting its 30% overseas limit. It’s the flip side of the M&A boom: the same bids that validate UK valuations are narrowing the pool managers have to fish in. Even so, around three-quarters of the portfolio remains in the UK, including this year’s contrarian additions, B&M European Value Retail (LSE:BME) and Land Securities Group (LSE:LAND), so they do see value at home, but not quite enough to reduce their non-UK allocation like others in the sector.
Against the tide
Taken together, the sector’s move home puts it firmly at odds with the wider market. As the chart below shows, money has left UK equity funds in almost every month of the past five years, and the selling has gathered pace in both 2025 and 2026, even as market returns have improved. Moreover, global funds network Calastone reckons 2025 marked a full decade of uninterrupted selling.
UK EQUITY FLOWS
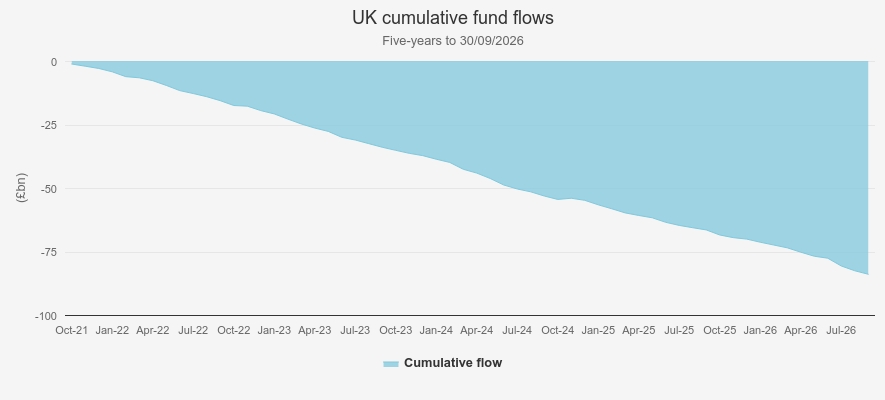
Source: Morningstar, Kepler calculations
Pensions have been heading a similar way. Of every £100 a typical UK workplace pension holds in shares, just £8 is invested in British companies, against £82 for US pension funds and £45 in Australia. Some home bias is natural in the US, whose market makes up more than 60% of global indices, but Britain’s pensions look closer to an anti-home bias. In 1992 they owned almost a third of the UK stock market. Today, pension funds and insurers together own just 1.5%, while overseas investors own a record 58.8%. Efforts to reverse that are under way. Under last year’s Mansion House Accord, the largest workplace pension providers pledged to put at least 5% of their default funds into UK assets by 2030, though mostly through private markets rather than listed shares. For now, the UK has lost its natural domestic buyer.
What might the managers be seeing?
The managers’ own explanations keep coming back to one thing: valuation. After such a long run of selling, the UK looks cheap by most yardsticks. On one of the most used, the forward price-to-earnings (P/E) ratio, UK shares trade on around 12 times earnings. Put simply, investors pay roughly £12 for every £1 of profit companies are expected to make over the next year, against about £15 in Europe, £17 in Japan and £24 in the US, as the chart below shows. Sector mix explains part of the gap, with the UK heavy in banks, energy and mining rather than tech. But the discount persists against Europe and Japan too.
STOCK MARKET VALUATION COMPARISON
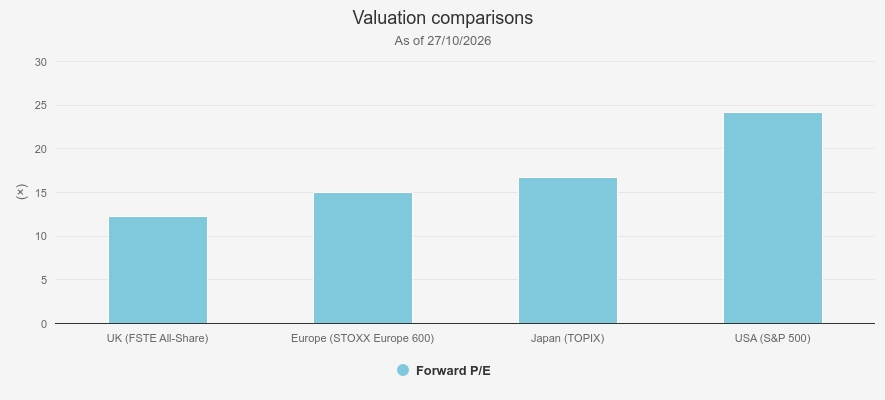
Source: Bloomberg
For income managers, valuations at this level make it hard to ignore. The UK market is also forecast to yield around 3.3%, ahead of all three comparators in the chart, and that’s before considering the buybacks many UK companies are running alongside their dividends. FTSE 100 companies, for example, bought back around £36 billion of their own shares in the first half of this year alone, almost three times as much as in the whole of 2017. Payouts are growing too. UK companies paid a record £35.3 billion in the second quarter, led by banks, which paid a record £11.1 billion, up more than a fifth.
Persisting at such a discount will inevitably attract attention eventually, and we’d argue it already has. If British investors have been slow to spot the value, overseas buyers have not. Offers for UK companies passed $231 billion by the end of June, according to LSEG, already above the total for the whole of 2025. Among listed companies, public takeovers passed £75 billion by the end of September, almost double last year’s total, with overseas bidders behind 94% of the value. Five FTSE 100 companies have received bids this year, including Segro, Schroders, Intertek and Beazley, at an average premium of around 44%.
We think that the combination of strong yields, growing dividends and the potential for further capital returns, whether through buybacks or bids, all at valuations below most global peers, changes the maths for an income manager weighing up an overseas holding.
Valuation isn’t the whole story, though, and the managers aren’t blind to the scratches. As Del Boy would tell you, only a plonker would pretend there aren’t any. This year Britain has lost a prime minister to a party revolt, 10-year gilt yields have touched their highest level since 2007 and an energy shock from the war in Iran has pushed inflation back up to 3.5%, leaving the Bank of England poised to raise rates rather than cut them. But beneath the headlines, the UK is looking surprisingly functional.
Annual GDP growth has more than tripled this year, from 0.6% in January to 2.1% in August, its fastest pace since 2022. Unemployment has fallen back to 4.7%, from 5.2% at the turn of the year, and households are saving almost £9 of every £100 they earn, against less than £6 before the pandemic. That’s a cautious consumer in our eyes, though October’s Budget may alleviate some stress here, leaving income tax rates untouched, extending the cuts to VAT on household electricity and fuel duty to July 2027 and launching a £4.7bn scheme for first-time buyers. Frozen tax thresholds will still pinch, but a Budget that eases the cost of living without spooking the gilt market gives that cushion a better chance of being spent, a potential tailwind for domestically focussed areas like banks, housebuilders and mid-caps the managers have been buying.
The public finances are turning too. Last year Britain ran a deficit of 5.3% of GDP, second only to the US in the G7, but as the chart below shows, the IMF expects it to be the smallest in the group by 2031, at 1.4%. The OBR is a little more cautious, at 1.8% by 2030-31, as it builds in a cushion for the Iran war and slower growth, but either way the deficit is set to more than halve. With debt still around 94% of GDP there’s little room for error, but a credible path to lower borrowing is what eventually brings gilt yields down, feeding through to mortgage rates, company borrowing costs and the valuations investors will pay for UK assets.
GOVERNMENT BORROWING COMPARISON
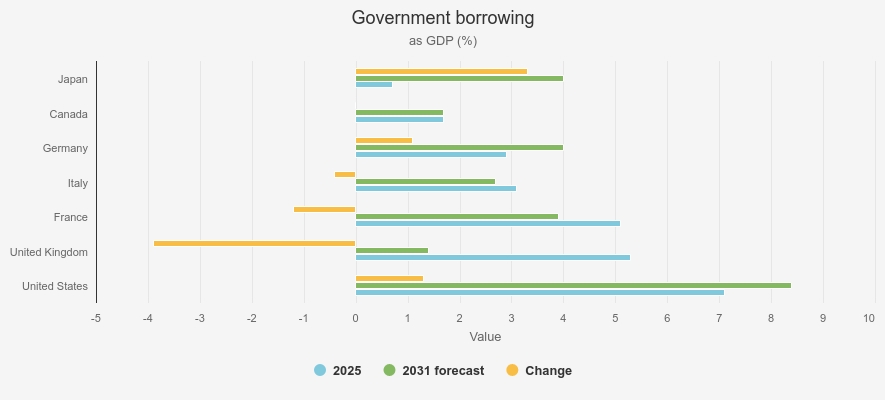
Source: IMF World Economic Outlook, October 2026
Final thoughts
Del Boy spent years chasing the next big thing, only to find his fortune gathering dust in the garage all along. British investors have spent the best part of a decade doing much the same. The managers who know UK companies best, and who are free to look abroad, are increasingly choosing not to, finding better value at home in everything from data businesses the market fears AI will disrupt to the REITs and mid-caps that bidders keep picking off, at least in the equity income sector so far. They are doing so while private investors and pension funds head for the exit, on valuations low enough that overseas bidders keep swooping, and against an economy that is steadier than the mood implies.
None of this makes the UK risk-free. Politics, bond yields and inflation could all yet spoil the party, and nobody can promise that this time next year we’ll be millionaires. But the bigger lesson may be that how Britain feels day to day, at the checkout or on hold to the GP, is a poor guide to how its companies are doing. After a decade of selling, many investors’ portfolios reflect the national mood more than the opportunity. For anyone whose UK exposure has quietly dwindled to almost nothing, it may be worth asking whether that is still a deliberate decision, or simply a habit. Del Boy found his fortune under his own nose. It might be worth checking yours.
Kepler Partners is a third-party supplier and not part of interactive investor. Neither Kepler Partners or interactive investor will be responsible for any losses that may be incurred as a result of a trading idea.
These articles are provided for information purposes only. Occasionally, an opinion about whether to buy or sell a specific investment may be provided by third parties. The content is not intended to be a personal recommendation to buy or sell any financial instrument or product, or to adopt any investment strategy as it is not provided based on an assessment of your investing knowledge and experience, your financial situation or your investment objectives. The value of your investments, and the income derived from them, may go down as well as up. You may not get back all the money that you invest. The investments referred to in this article may not be suitable for all investors, and if in doubt, an investor should seek advice from a qualified investment adviser.
Full performance can be found on the company or index summary page on the interactive investor website. Simply click on the company's or index name highlighted in the article.
Important Information
Kepler Partners is not authorised to make recommendations to Retail Clients. This report is based on factual information only, and is solely for information purposes only and any views contained in it must not be construed as investment or tax advice or a recommendation to buy, sell or take any action in relation to any investment.
This report has been issued by Kepler Partners LLP solely for information purposes only and the views contained in it must not be construed as investment or tax advice or a recommendation to buy, sell or take any action in relation to any investment. If you are unclear about any of the information on this website or its suitability for you, please contact your financial or tax adviser, or an independent financial or tax adviser before making any investment or financial decisions.
The information provided on this website is not intended for distribution to, or use by, any person or entity in any jurisdiction or country where such distribution or use would be contrary to law or regulation or which would subject Kepler Partners LLP to any registration requirement within such jurisdiction or country. Persons who access this information are required to inform themselves and to comply with any such restrictions. In particular, this website is exclusively for non-US Persons. The information in this website is not for distribution to and does not constitute an offer to sell or the solicitation of any offer to buy any securities in the United States of America to or for the benefit of US Persons.
This is a marketing document, should be considered non-independent research and is subject to the rules in COBS 12.3 relating to such research. It has not been prepared in accordance with legal requirements designed to promote the independence of investment research.
No representation or warranty, express or implied, is given by any person as to the accuracy or completeness of the information and no responsibility or liability is accepted for the accuracy or sufficiency of any of the information, for any errors, omissions or misstatements, negligent or otherwise. Any views and opinions, whilst given in good faith, are subject to change without notice.
This is not an official confirmation of terms and is not to be taken as advice to take any action in relation to any investment mentioned herein. Any prices or quotations contained herein are indicative only.
Kepler Partners LLP (including its partners, employees and representatives) or a connected person may have positions in or options on the securities detailed in this report, and may buy, sell or offer to purchase or sell such securities from time to time, but will at all times be subject to restrictions imposed by the firm's internal rules. A copy of the firm's conflict of interest policy is available on request.
Past performance is not necessarily a guide to the future. The value of investments can fall as well as rise and you may get back less than you invested when you decide to sell your investments. It is strongly recommended that Independent financial advice should be taken before entering into any financial transaction.
PLEASE SEE ALSO OUR TERMS AND CONDITIONS
Kepler Partners LLP is a limited liability partnership registered in England and Wales at 9/10 Savile Row, London W1S 3PF with registered number OC334771.
Kepler Partners LLP is authorised and regulated by the Financial Conduct Authority.