Why you should look beyond labels in style investing
Growth and value investing styles rotate, but a Kepler analyst examines investment trusts in five regions, highlighting what matters more than style.
10th July 2026 14:02

This content is provided by Kepler Trust Intelligence, an investment trust focused website for private and professional investors. Kepler Trust Intelligence is a third-party supplier and not part of interactive investor. It is provided for information only and does not constitute a personal recommendation.
Material produced by Kepler Trust Intelligence should be considered a marketing communication, and is not independent research.
This summer, as 48 nations compete across the US, Canada and Mexico in the largest football World Cup in history, the question is the same as always: do you build a team to control possession and pass opponents into submission, or do you absorb pressure and strike explosively on the counter? Both have won World Cups. Neither works in every era.
This year’s tournament has already made the point vividly. France lit up the group stage, scoring 10 goals in three games, the quintessential growth play. Conversely, Cape Verde, the debutant nation ranked 67th in the world who won the hearts of all supporters, held reigning European champions Spain to a goalless draw on defensive discipline. Glamour versus grit. Explosive upside versus structured resilience.
We think investors have been running the same ‘growth versus value’ argument for decades. Growth managers build portfolios around companies with explosive potential, high earnings momentum and expanding markets, betting on the ability to reinvest at rates competitors can’t match. Value managers scour neglected sectors and mispriced stocks, backing the belief that markets overcorrect and that patience eventually pays.
The whipsaw between the two since the turn of the decade has been brutal: the pandemic turbocharged growth, the rate cycle that followed swung the pendulum firmly to value, then AI and semiconductors swung it back again. Few style investors have escaped unscathed, and those who planted their flag firmly in one camp have found themselves richly rewarded, then humbled, sometimes within the same calendar year.
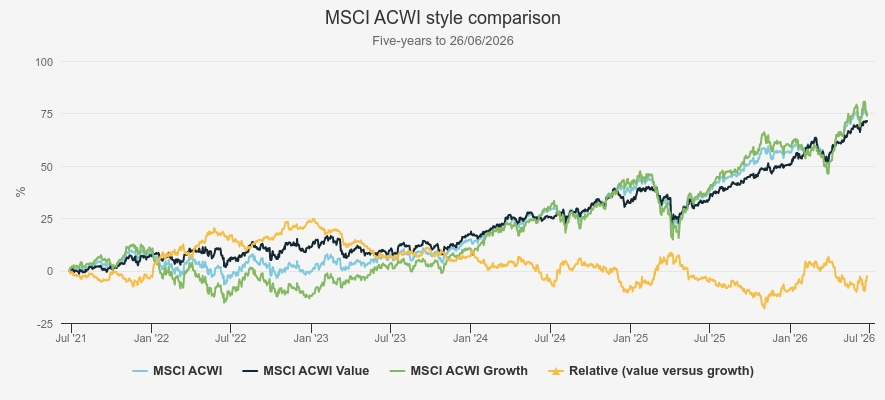
The chart below tracks that five-year journey through the MSCI ACWI Growth and Value indices, alongside the broader ACWI, capturing both developed and developing markets. From late 2021 to 2023, rising rates and inflation drove investors away from expensive, long-duration growth stocks and into cyclicals, and value meaningfully outpaced growth. From mid-2023, the AI-driven surge in technology reversed that decisively, and the gap between the two widened sharply as a cohort of global AI and semiconductor names delivered exceptional returns.
STYLE COMPARISON
Source: Morningstar. Past performance is not a reliable indicator of future results
Yet the relative line has not moved in one direction since. Value staged meaningful recoveries in mid-2024, late 2024 into 2025, and again in late 2025 into early 2026, on bouts of AI scepticism, rate uncertainty and, most recently, a geopolitical shock to energy prices. Growth reasserted itself each time on a different combination of factors: falling rate expectations, resilient earnings from the AI cohort and valuations becoming attractive enough to draw investors back in.
It’s a powerful chart, underlining just how quickly sentiment has swung in recent years, but the headline figures only tell part of the story. At a regional level, the dynamics get more interesting still. Value has dominated across almost every major market over the past five years, from Japan’s governance reforms to Brazil’s commodity-driven re-rating. Yet look beneath the index level and a different story emerges: some of the strongest individual returns have come from trusts blending styles.
In this piece, we argue that the more useful question for investors isn’t which style is currently winning, but how convincingly it’s being expressed. A dominant style at the index level, we find, guarantees success for almost no one, and dooms almost no one either. What has mattered more is process: managers testing whether an opportunity is genuinely mispriced or genuinely well positioned, rather than simply following whichever label the market has settled on. Here, we trace that argument through five regions and the trusts making the most compelling case in each.
Value dominance in Japan
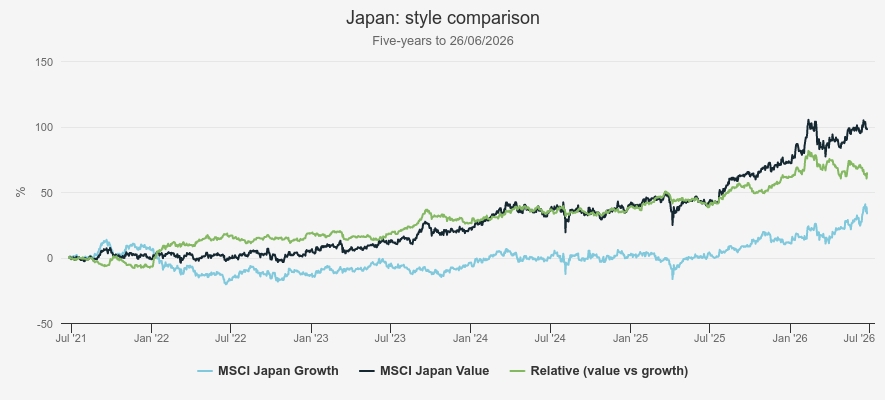
Few markets illustrate the power of structural change quite like Japan. Over much of the past five years, value has decisively outpaced growth, a run built on the country’s corporate governance overhaul. The origins trace back to Shinzo Abe’s Abenomics in 2012, but it was the Tokyo Stock Exchange’s (TSE) sharper intervention from 2023 that proved decisive, explicitly naming and shaming companies trading below book value and demanding published plans for improvement.
What had been a slow, incremental cultural shift suddenly had teeth: Japan’s price-to-book ratio has risen to 1.8× buoyed by record share buybacks, sharply rising dividend payouts year after year and cross-shareholding being unwound at pace, a meaningful uptick from a low of around 1.0× in 2012.
STYLE COMPARISON
Source: Morningstar. Past performance is not a reliable indicator of future results
But the above chart tells a second, more recent story too. From February 2026, growth has accelerated sharply relative to value. AI is the clearest catalyst, with Japan’s position in the global semiconductor supply chain drawing significant renewed attention, but we think the ongoing reform push deserves real credit too: even growth companies already meeting the TSE’s capital efficiency thresholds have sharpened how they deploy capital, mindful of the re-rating enjoyed by value peers that embraced reform most visibly. Reform, in other words, was never a value-only story, as its original ambition was to raise standards across the entire market.
Against that backdrop, we’d argue the strategies that have performed best are better classified as balanced. More growth-focused names such asJPMorgan Japanese Ord (LSE:JFJ) understandably found the going tougher in such a value-driven environment, though have seen returns pick up over the past year, a trend that could prove supportive if growth’s momentum continues. But two trusts that have captured alpha on both sides of that style divide, through very different lenses, are Schroder Japan Trust Ord (LSE:SJG) and CC Japan Income & Growth Ord (LSE:CCJI).
SJG’s manager, Masaki Taketsume, hunts for undervalued businesses across the market, with a meaningful allocation to smaller companies where mispricing runs deepest, often favouring those further down a value chain over the obvious, already re-rated names at the top of it. That expertise in the market and willingness to blend elements of both styles has helped the trust deliver a NAV total return 40 percentage points ahead of the TOPIX over five years. CCJI, run by Richard Aston since its December 2015 launch, takes a different route, combining exposure to structural themes such as automation and digitalisation with companies benefiting from improving shareholder returns and balance sheet discipline, the substance of reform rather than its earliest, deep-value beneficiaries; that preference for blending traits has seen CCJI almost double the TOPIX’s return.
STYLE EXPOSURE OF JAPAN TRUSTS
| Five-year cum-fair NAV total return (%) | Equity style value (%) | Equity style core (%) | Equity style growth (%) | |
| CCJI | 117.1 | 24.9 | 48.9 | 26.2 |
| SJG | 101.5 | 22.9 | 35.6 | 41.5 |
| JFJ | 38.5 | 3 | 41.7 | 55.3 |
| BGFD | 9.1 | 18.5 | 60.2 | 21.4 |
| TOPIX* | 61.6 | |||
*Total return. Source: Morningstar, as of 26/06/2026. Past performance is not a reliable indicator of future results.
Value economies: UK and Europe ex-UK
The UK and Europe ex-UK share a similar structural story. Neither carries anything like the technology weighting of the US, where the sector makes up close to 40% of the index. The FTSE All-Share holds just 2.4% in technology compared to the more ‘value-oriented’ sectors like financials at 30% and 9.4% in energy. Europe ex-UK is somewhat better diversified at 12% technology, but financials and industrials dominate at a combined 44%. Both, therefore, have seen value at a regional level outpace growth, hardly a surprise given the market composition.
The table below, merging the top value, balanced and growth names in the UK Equity Income and UK All Companies sectors, has been ordered by value tilt. To test how things have held, they have also been cross-referenced for style positioning against five-year performance. The pattern is instructive: value tilt has supported strong returns over the period, but how that tilt has been expressed has mattered just as much.
STYLE EXPOSURE OF EUROPE TRUSTS
| Five-year cum-fair NAV total return (%) | Equity style value % | Equity style core % | Equity style growth % | |
| MRCH | 66.2 | 71.5 | 25.3 | 3.2 |
| TMPL | 97.5 | 68.5 | 25.9 | 5.6 |
| AEI | 56.4 | 63.9 | 30.7 | 5.4 |
| SDV | -10.3 | 62.1 | 32.4 | 5.5 |
| LWDB | 89 | 44.5 | 37.9 | 17.6 |
| SCF | 52.9 | 40.6 | 44.4 | 15 |
| JCH | 59.3 | 37.8 | 51.4 | 10.8 |
| BGUK | 8.8 | 19.2 | 39.1 | 41.6 |
| FTSE All-Share* | 65.6 |
*Total return. Source: Morningstar, as of 26/06/2026. Past performance is not a reliable indicator of future results
Chelverton UK Dividend Trust Ord (LSE:SDV) makes that point well. Despite one of the deepest value tilts in the peer group, it has delivered negative returns over five years: its focus on mid- and small-cap income names meant it missed much of the large-cap value rally that has driven the sector’s strongest performers.
The standout, though, is Temple Bar Ord (LSE:TMPL), which has built its reputation as one of the sector’s go-to value names. Managers Ian Lance and Nick Purves look for companies trading well below fair value, but weigh quality just as heavily, screening against the earnings and financial health risk that a purely numbers-driven approach can fall into. That valuation discipline has underpinned a five-year NAV return of almost 100%, against 65% for the FTSE All-Share, and the strongest in the peer group.
More balanced approaches have also held up well. JPMorgan Claverhouse Ord (LSE:JCH)and Schroder Income Growth Ord (LSE:SCF) have delivered returns broadly in line with the index, evidence that a balanced style need not be a handicap in a value- or growth-driven market. Law Debenture Corporation Ord (LSE:LWDB)has gone one better: similarly balanced and delivered an 89% NAV total return, ahead of the index. Its managers target undervalued companies the market has overlooked, but quality remains the gatekeeper, steering them toward businesses with durable competitive advantages, proven management and reliable cash generation. It also benefits from the strength of its IPS division, providing recurring contractual revenue, further differentiating it from a straightforward equity income play.
At the other end, Baillie Gifford UK Growth Trust Ord (LSE:BGUK) has delivered minimal returns in an environment that has consistently rewarded the opposite positioning, but is a well-placed option, also at a wide discount, if sentiment towards more growth-focused UK SMIDs turn.
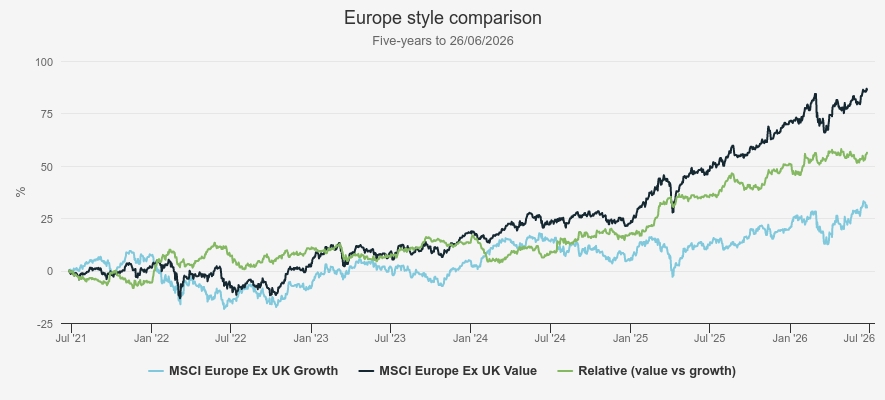
Europe tells a similar story. Value has led growth for almost the entire five-year period, a lead that accelerated sharply from early 2024. Germany’s expansionary fiscal turn, including higher defence and infrastructure spending, has boosted domestic activity, while energy prices, climbing amid the conflict between the US and Iran, have cut both ways: a direct lift for energy and resource names, but also a genuine constraint on Europe’s AI ambitions. Unlike the US, where the AI trade has been led directly by chipmakers and hyperscalers, Europe’s exposure runs mostly through the infrastructure required to power AI, and that infrastructure is increasingly bottlenecked by electricity cost and availability. Capital has been redirected towards utilities and energy infrastructure rather than the software and chip names driving the US rally, reinforcing value’s grip on the region.
STYLE COMPARISON
Source: Morningstar. Past performance is not a reliable indicator of future results
But interestingly, Europe’s best performers have not been won through heavy value tilts alone. Unlike the UK peer group, the region’s trusts are not, on the whole, deep value plays, and it is a more balanced style that has delivered the strongest results. JPMorgan European Growth & Income Ord (LSE:JEGI)has captured that shift particularly well, its balance of quality, value and momentum over the period, expressed through small individual stock positions rather than big sector bets, has allowed it to capture the opportunities while sidestepping some of the problem areas that struggled. This has supported a NAV total return of 83.4% against 54.9% for the benchmark, the strongest returns of its European peers by some distance.
Baillie Gifford European Growth Ord (LSE:BGEU) sits at the other end of the spectrum, down 17.9% over five years, the underperformance reflecting a genuine regime change as investors have favoured domestic recovery and value over the high-growth profile that has rewarded US innovation. There are signs of a turn, though: a pick-up in IPO activity, including a successful Nasdaq debut for BGEU’s own largest holding, Bending Spoons SpA (NASDAQ:BSP), and a new manager in April, Joe Faraday, who is still very much a growth investor but is reconfiguring the portfolio with a more valuation-conscious style that reflects current market conditions.
STYLE EXPOSURE OF GEM TRUSTS
| Five-year cum-fair NAV total return (%) | Equity style value (%) | Equity style core (%) | Equity style growth (%) | |
| JEGI | 83.4 | 24.4 | 48.2 | 27.4 |
| FEV | 50.5 | 18.9 | 49.2 | 31.9 |
| EOT | 11.6 | 0.4 | 38 | 61.6 |
| BRGE | 11.1 | 13.5 | 38.2 | 48.3 |
| BGEU | -17.9 | 12.7 | 47 | 40.3 |
| MSCI Europe ex UK* | 54.9 |
*Total return. Source: Morningstar, as of 26/06/2026. Past performance is not a reliable indicator of future results.
A Story of Seven
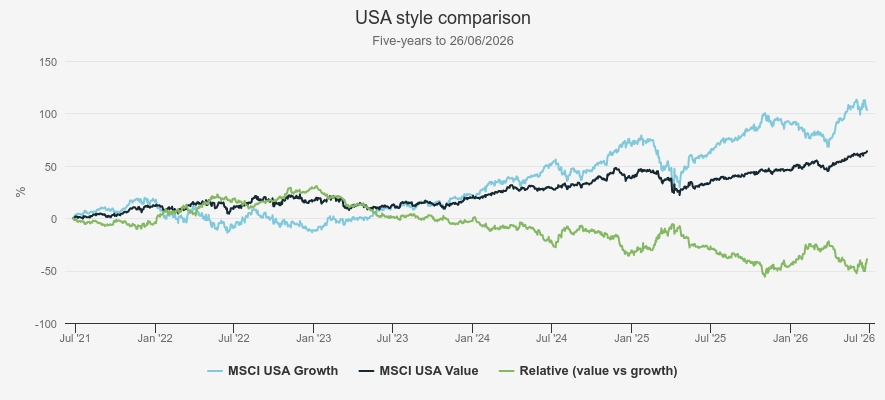
The US is the clearest growth story in this piece, and unsurprisingly so. Technology accounts for close to 40% of the index, dwarfing the weighting of any other region we cover, and AI has been the engine behind almost all of it in recent years.
STYLE COMPARISON
Source: Morningstar. Past performance is not a reliable indicator of future results
But the headline figure obscures just how narrow that dominance has actually been. The Magnificent Seven now make up over 30% of the S&P 500, leaving 493 other constituents to share the rest. Strip that concentration out using an equal-weighted version of the index and the picture changes considerably: from the start of 2023, to 2025 year end, the cap-weighted S&P 500 outperformed its equal-weighted counterpart by roughly 32%, one of the largest such gaps on record, narrowly exceeding even the dot-com era. Growth’s apparent dominance in the US is, in other words, to a significant extent the dominance of a handful of stocks rather than a broad-based style story, and investors, given that concentration risk, have started looking elsewhere, not because they've turned negative on America, but because so much of the index's return now rests on a handful of AI-exposed names.
That tension plays out clearly across the sector’s trusts. Baillie Gifford US Growth Ord (LSE:USA), managed by Gary Robinson and Kirsty Gibson, is the purest expression of that growth tilt, extending even to a 50% allowance for private companies for access to unlisted growth names most peers cannot reach. It struggled badly through 2021 and 2022’s inflation-driven de-rating. Although it has outperformed the S&P 500 every year since 2023, the scars of that drawdown still weigh on its five-year number. Pershing Square Holdings Ord (LSE:PSH) sits at the growth end too, but via an entirely different route: manager Bill Ackman concentrates the portfolio in around eight to 12 high-conviction positions rather than pursuing a diversified growth strategy.
North American Income Trust Ord (LSE:NAIT), managed by Fran Radano and Jeremiah Buckley, shows just how differently a value-tilted, income-focussed approach can look: around 50 large-cap holdings skewed towards higher-yielding sectors such as energy, healthcare and financials, with a dividend that has grown every year since 2012. It’s almost unrecognisable next to the S&P 500, a deliberate diversification away from the mega-cap technology names that dominate the US market that has held its own against growth-focused trusts exposed to the Magnificent Seven.
We think JPMorgan American Ord (LSE:JAM) is one of the most interesting cases precisely because its positioning has shifted with the market. Run jointly by Felise Agranoff on growth and Jack Caffrey and Graham Spence on value, JAM has moved from a growth tilt to a more balanced orientation having added more value companies and trimming Microsoft Corp (NASDAQ:MSFT) on AI-payoff concerns while staying constructive on NVIDIA Corp (NASDAQ:NVDA) and Broadcom Inc (NASDAQ:AVGO). That willingness to separate the AI theme from individual stock valuations has made JAM both the sector’s most balanced trust by style and its best performer over five years. Yet even JAM's 89% five-year return trails the S&P 500’s 94%, and so does every other trust in this table. That is the concentration story again, in miniature: when close to a third of an index’s return sits in seven stocks, a diversified active portfolio, however well run, may not hold each stock at the weighting of the index, so has potential to struggle in keeping pace when they perform well.
STYLE EXPOSURE OF NORTH AMERICAN TRUSTS
| Five-year cum-fair NAV total return (%) | Equity style value (%) | Equity style core (%) | Equity style growth (%) | |
| JAM | 89 | 39.8 | 36.2 | 24 |
| NAIT | 75.9 | 61.5 | 30.9 | 7.7 |
| BRAI | 70.7 | 51.9 | 35 | 13 |
| PSH | 64.8 | 9.1 | 45.1 | 45.9 |
| CGI | 51.2 | 9.5 | 36.2 | 54.7 |
| USA | 6.7 | 4.4 | 30.6 | 65.1 |
| S&P 500* | 94.7 |
*Total return. Source: Morningstar, as of 26/06/2026. Past performance is not a reliable indicator of future results.
Global emerging markets
Value has led growth across emerging markets as a whole over the past five years, but that headline masks a region pulling in several directions. Taiwan, home to Taiwan Semiconductor Manufacturing Co Ltd ADR (NYSE:TSM), is an unambiguous growth story that has only strengthened as AI demand accelerates; Brazil is the mirror image, a classic value play on a forward P/E of 9–10×, cheap even by EM standards and geared to higher rates and commodity prices.
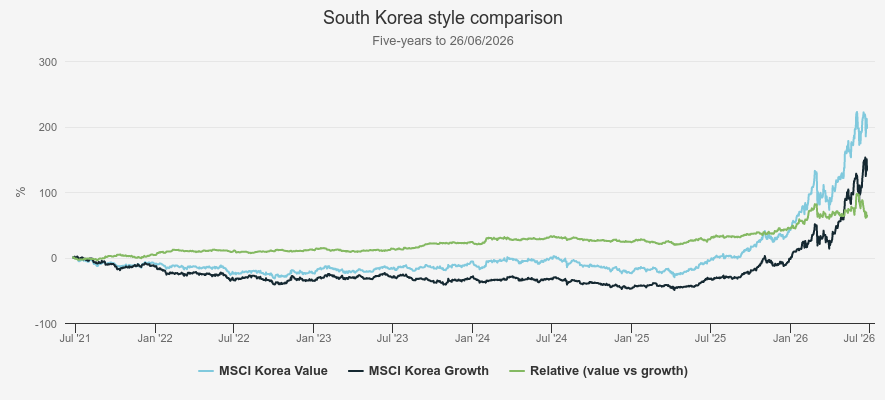
But what really stood out in our analysis was South Korea. Given Samsung Electronics Co Ltd DR (LSE:SMSN) and SK Hynix’s central role in the same AI memory boom powering other global nations, one might think growth has ruled. Yet value held a persistent lead over growth right through to late 2025, a legacy that, we think, is down to Korea’s Corporate Value-Up initiative. Launched in 2024, and inspired by Japan’s reforms, Korea wrote directors’ fiduciary duty to all shareholders into its Commercial Act in 2025 and tightened dividend tax incentives in 2026 to force disclosure. Consequently, the Value-Up Index is up more than 130% since launch, with 174 companies now signed up. Only in recent months has growth begun closing the gap, driven by AI enthusiasm and the subsequent strong performance from Korea’s largest AI-linked names.
STYLE COMPARISON
Source: Morningstar. Past performance is not a reliable indicator of future results
Yes, value has dominated the region overall, yet more growth titled names have delivered the best returns. Templeton Emerging Markets (TEM) andFidelity Emerging Markets Ord (LSE:FEML)show why: both have captured genuine exposure to the narrow cohort of markets and stocks driving EM returns, largely linked to the AI-chip supply chain booming.
That said, quality acts as the backstop for both, so they are not just buying growth at any price, alongside a valuation discipline that steers them to undervalued, or more ‘value-oriented’ parts of the market, Brazil being the clearest example. FEML pushes further still, using shorts, around 30% of net assets, and off-benchmark plays like Naspers, to source alpha from parts of the market a long-only peer simply can’t reach.
STYLE EXPOSURE OF GEM TRUSTS
| Five-year cum-fair NAV total return (%) | Equity style value (%) | Equity style core (%) | Equity style growth (%) | |
| AWEM** | 90.1 | 12.3 | 41.4 | 46.3 |
| TEM | 81.2 | 24.1 | 25.6 | 50.3 |
| BRFI | 80.7 | 44.4 | 40.1 | 15.5 |
| FEML | 77.8 | 23.6 | 21.3 | 55.1 |
| JEMI | 67.9 | 39.8 | 42.4 | 17.8 |
| UEM | 48.6 | 19.3 | 47.8 | 32.9 |
| JMGI | 43.1 | 13.9 | 45.1 | 41 |
| MMIT | 43 | 2.3 | 26.7 | 70.9 |
| BEMO | 18.8 | 35.2 | 26.7 | 38.1 |
| MSCI EM* | 47.3 |
*Total return. **returns since launch in 2023. Excluded JPMorgan Emerging EMEA given Russian holdings. Source: Morningstar, as of 26/06/2026. Past performance is not a reliable indicator of future results
China shows the same lesson most starkly. It’s had a torrid run over the past five years, plagued by regulatory crackdowns and property market stress, but has seen periods of strength more recently. But overall, it’s largely been a value story, as its growth names were scarred by the 2021–23 regulatory crackdown. Of the sector’s three trusts,Fidelity China Special Situations Ord (LSE:FCSS)anchors value andJPMorgan China Growth & Income Ord (LSE:JCGI) sits at the growth extreme, but Baillie Gifford China Growth Trust Ord (LSE:BGCG) takes a more blended approach.
That balance has been rewarded: BGCG has delivered the best returns of the AIC China sector over both three and five years, helped by a portfolio generating three-quarters of its revenue domestically, insulated from trade friction, and with access to unlisted companies its listed-only peers cannot reach. Across this whole section, it hasn’t been raw exposure to growth or value that has separated winners from laggards, but balanced exposure, blending elements of both.
STYLE EXPOSURE OF CHINA TRUSTS
| Three-year cum-fair NAV total return (%) | Five-year cum-fair NAV total return (%) | Equity style value % | Equity style core % | Equity style growth % | |
| BGCG | 37.5 | -27.9 | 18.3 | 49.9 | 31.8 |
| FCSS | 27.2 | -31.9 | 44.6 | 38.7 | 16.7 |
| JCGI | 16.1 | -47.3 | 7.1 | 53.2 | 39.7 |
| MSCI China* | 18.7 | -30.7 |
*Total return. Source: Morningstar, as of 26/06/2026. Past performance is not a reliable indicator of future results.
Final thoughts
What we think ties these examples together isn’t a preference for one style over another; both growth and value have delivered strong returns and, at times, struggled, sometimes in the same region. What mattered more was process: the ability to keep spotting opportunities as conditions evolved, some in value, some in growth or somewhere in between, rather than sitting anchored to whichever style the index happened to be rewarding.
The UK looks like the exception on the surface, where deep value conviction paired with a hard quality screen delivered the standout return, yet the more balanced options there held their own too, despite carrying far less of a value tilt.
In the current market, a dominant style at the index level, in our view, doesn’t guarantee success for those who follow it, nor does it doom those who don’t; what matters more is a manager’s ability to keep testing and evolving as conditions change. For investors, the lesson isn’t to chase whichever style happens to be working, it’s to build a portfolio that doesn’t depend on guessing which one comes next.
Spreading exposure across regions and styles, backed by managers with the discipline and flexibility to adapt as conditions change, should help build a more resilient and diversified portfolio.
Kepler Partners is a third-party supplier and not part of interactive investor. Neither Kepler Partners or interactive investor will be responsible for any losses that may be incurred as a result of a trading idea.
These articles are provided for information purposes only. Occasionally, an opinion about whether to buy or sell a specific investment may be provided by third parties. The content is not intended to be a personal recommendation to buy or sell any financial instrument or product, or to adopt any investment strategy as it is not provided based on an assessment of your investing knowledge and experience, your financial situation or your investment objectives. The value of your investments, and the income derived from them, may go down as well as up. You may not get back all the money that you invest. The investments referred to in this article may not be suitable for all investors, and if in doubt, an investor should seek advice from a qualified investment adviser.
Full performance can be found on the company or index summary page on the interactive investor website. Simply click on the company's or index name highlighted in the article.
Important Information
Kepler Partners is not authorised to make recommendations to Retail Clients. This report is based on factual information only, and is solely for information purposes only and any views contained in it must not be construed as investment or tax advice or a recommendation to buy, sell or take any action in relation to any investment.
This report has been issued by Kepler Partners LLP solely for information purposes only and the views contained in it must not be construed as investment or tax advice or a recommendation to buy, sell or take any action in relation to any investment. If you are unclear about any of the information on this website or its suitability for you, please contact your financial or tax adviser, or an independent financial or tax adviser before making any investment or financial decisions.
The information provided on this website is not intended for distribution to, or use by, any person or entity in any jurisdiction or country where such distribution or use would be contrary to law or regulation or which would subject Kepler Partners LLP to any registration requirement within such jurisdiction or country. Persons who access this information are required to inform themselves and to comply with any such restrictions. In particular, this website is exclusively for non-US Persons. The information in this website is not for distribution to and does not constitute an offer to sell or the solicitation of any offer to buy any securities in the United States of America to or for the benefit of US Persons.
This is a marketing document, should be considered non-independent research and is subject to the rules in COBS 12.3 relating to such research. It has not been prepared in accordance with legal requirements designed to promote the independence of investment research.
No representation or warranty, express or implied, is given by any person as to the accuracy or completeness of the information and no responsibility or liability is accepted for the accuracy or sufficiency of any of the information, for any errors, omissions or misstatements, negligent or otherwise. Any views and opinions, whilst given in good faith, are subject to change without notice.
This is not an official confirmation of terms and is not to be taken as advice to take any action in relation to any investment mentioned herein. Any prices or quotations contained herein are indicative only.
Kepler Partners LLP (including its partners, employees and representatives) or a connected person may have positions in or options on the securities detailed in this report, and may buy, sell or offer to purchase or sell such securities from time to time, but will at all times be subject to restrictions imposed by the firm's internal rules. A copy of the firm's conflict of interest policy is available on request.
Past performance is not necessarily a guide to the future. The value of investments can fall as well as rise and you may get back less than you invested when you decide to sell your investments. It is strongly recommended that Independent financial advice should be taken before entering into any financial transaction.
PLEASE SEE ALSO OUR TERMS AND CONDITIONS
Kepler Partners LLP is a limited liability partnership registered in England and Wales at 9/10 Savile Row, London W1S 3PF with registered number OC334771.
Kepler Partners LLP is authorised and regulated by the Financial Conduct Authority.