10 years on from Brexit: top-performing funds and key trends
UK equity funds have suffered huge outflows since the Brexit vote, with global equity funds a key beneficiary. Kyle Caldwell runs through the data, and names the top-performing funds and sectors over the 10-year period.
24th June 2026 13:51
by Kyle Caldwell from interactive investor
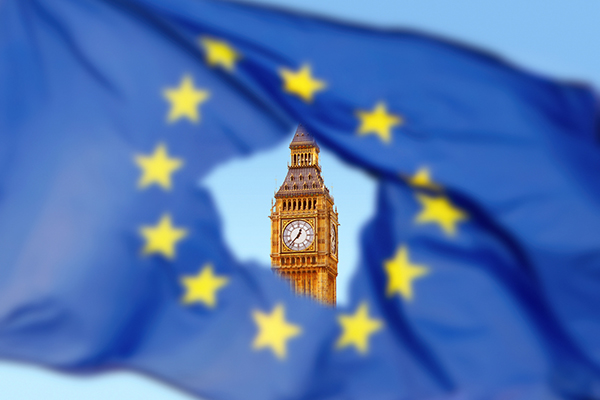
A decade on from the Brexit vote, a key trend among funds is that UK strategies have been given the thumbs down by many investors.
Figures from the Investment Association (IA) show that from May 2016, the month prior to the Brexit vote, the amount of funds under management for UK funds has shrunk by £40 billion.
In contrast, global funds have sold like hotcakes, leading to a rise in funds under management to around £176 billion.
- Our Services: SIPP Account | Stocks & Shares ISA | See all Investment Accounts
Initially, uncertainty over how Brexit would pan out led some investors to dial down on UK exposure and shop more overseas.
Those with long memories will recall that the unexpected Leave vote caused mayhem in UK markets. By the close of 27 June 2016, the FTSE 100 index had lost 4.5%, while the mid and small-cap indices were down over 10%. The pound slumped versus the dollar, around a week later dropping to a 31-year low.
But the markets rapidly shrugged off the panic. For example, by mid-July the FTSE 100 was 5% ahead of pre-vote levels as the internationally facing blue chips, which receive over 70% of earnings from overseas, benefited from the pound’s fall.
Other factors have dampened investor sentiment towards the UK over the past decade, including the revolving door of prime ministers (with the number now totalling seven), the ramifications of the Covid-19 pandemic, the war in Ukraine, and tensions in the Middle East.
For those who followed the money venturing overseas, this was a smart move. The sector returns below show that global funds have, on average, markedly outperformed UK funds.
| Investment Association (IA) fund sector | 10-year return | Funds under management in May 2016 | Funds under management in April 2026 |
| Global | 190.8% | £84.7 billion | £246.8 billion |
| Global Equity Income | 162.0% | £14.4 billion | £28.1 billion |
| UK Equity Income | 103.9% | £58.9 billion | £34.6 billion |
| UK All Companies | 99.2% | £158.1 billion | £147.1 billion |
| UK Smaller Companies | 82.1% | £12.2 billion | £6.9 billion |
Data from 24 June 2016 to 23 June 2026. Sourced from FE Analytics. Past performance is not a guide to future performance.
However, a key driver of returns for the top-performing global funds over the past decade is now giving some investors pause for thought, namely the strong gains made by the US and, in particular, the seven companies dubbed the “Magnificent Seven”: Amazon.com Inc (NASDAQ:AMZN), Alphabet Inc Class A (NASDAQ:GOOGL), NVIDIA Corp (NASDAQ:NVDA), Microsoft Corp (NASDAQ:MSFT), Meta Platforms Inc Class A (NASDAQ:META), Apple Inc (NASDAQ:AAPL), and Tesla Inc (NASDAQ:TSLA).
For example, the top-performing global fund, GAM Star Disruptive Growth, has Amazon as its top holding, on a 9.2% weighting, followed by Nvidia and Microsoft, which form 8.9% and 8.4% of the fund.
Tracker fund L&G Global 100 Index I Acc (B0CNH05) has also enjoyed big gains due to the make-up of the S&P 100 index it tracks.
It holds multinational blue-chip companies of major importance in global equity markets. The end result for L&G Global 100 Index Trust is significant weightings in US technology behemoths that have delivered exceptional performance for most of the past decade.
At present, this global tracker has nearly half its assets in five stocks: Nvidia, Apple, Microsoft, Alphabet and Amazon.
- Tax on cash but money market funds spared in ISA rule change
- How the experts would invest a SIPP at every life stage
However, some active funds, including Artemis Global Income and Orbis OEIC Global Equity, have delivered top returns despite being notably underweight the US.
In an interactive investor interview earlier this year, Artemis Global Income manager Jacob de Tusch-Lec explained that due to being a value fund he finds plenty of opportunities outside the US, noting that over the past five years value stocks in Europe and emerging markets have outperformed growth stocks.
- Artemis Global Income: Buying some portfolio insurance and bucking trend on US and AI
Top 10 performing global equity funds over 10 years
| Fund | Total return (%) |
| GAM Star Disruptive Growth | 412.5 |
| T. Rowe Price Global Focused Growth Equity | 401.2 |
| Xtrackers MSCI World Momentum ETF | 399.7 |
| L&G Global 100 Index Trust | 389.7 |
| L&G Cyber Security ETF | 374.2 |
| Guinness Global Innovators | 337.4 |
| MS INVF Global Opportunity | 329.8 |
| GMO Quality Investment | 327.6 |
| Artemis Global Income | 321.2 |
| Orbis OEIC Global Equity | 310.6 |
Data from 24 June 2016 to 23 June 2026. Sourced from FE Analytics. Past performance is not a guide to future performance.
Overall, the top three fund sectors since the Brexit vote have been Technology & Technological Innovation, North America and North American Smaller Companies, with gains of 557.4%, 267.2% and 211.7%.
Taking the individual gold medal for the best overall fund is Polar Capital Global Technology, with a whopping gain of 1,319%.
The next-best technology performers are iShares S&P 500 Information Technology Sector ETF, L&G Global Technology Index Trust, Herald Worldwide Technology Fund, and Liontrust Global Technology, with respective gains of 992.8%, 933.6%, 930.1% and 912.0%.
For investment trust fans, our columnist Ian Cowie recently covered the best performers since Brexit.
- Ian Cowie: the top investment trusts since Brexit
- Fund managers name their ‘secret sauce’ to successful stock picking
Ultimately, investors need to take a view on whether they are overexposed to the technology boom. As ever, balance and diversification are key, and ensuring there’s a mix of different investment styles and approaches is arguably even more important against a backdrop of US and global stock markets having become more concentrated following the strong gains for the Magnificent Seven stocks over the past decade.
Moreover, while UK funds have underperformed global funds over the past decade, starting valuations today make the UK stock market more appealing, which could translate into a stronger decade of performance.
It’s also worth noting that over five years the performance gap between global equity and UK equity funds has narrowed, particularly for UK equity income funds. Interest rate rises have led to a renaissance for value investing, which has been a key driver of this.
However, those interest rate rises have been a big headwind for UK smaller companies, with the average fund losing -13.2% over the past five years.
| Investment Association (IA) fund sector | Five-year return |
| Global Equity Income | 60.2% |
| UK Equity Income | 48.3% |
| Global | 47.8% |
| UK All Companies | 31.1% |
| UK Smaller Companies | -13.2% |
Data from 24 June 2021 to 23 June 2026. Sourced from FE Analytics. Past performance is not a guide to future performance.
UK fund winners and losers 10 years on
Turning our attention to the UK, there are only five funds that have beaten the average global equity fund return of 193.7% over the past decade: Artemis SmartGARP UK Equity, Artemis UK Select, JPM UK Equity Plus, Dimensional UK Value and Man Income , with respective total returns of 281.1%, 244.8%, 200.2%, 198.0% and 191.5%.
Although it is worth noting that the average return for the three UK equity sectors does trump inflation, with the Consumer Price Index (CPI) return coming in at 41.8% over the past decade.
However, bond investors should look away now. Of the 57 fund sectors, only two lost money over the 10-year period: Index-Linked Gilts (-17.1%) and UK gilts (-9.3%).
- Brexit: biggest winners and losers 10 years on
- Sign up to our free newsletter for investment ideas, latest news and award-winning analysis
Funds that invest in UK government bonds were hard hit in 2022 for two reasons. First, in an attempt to tackle sky-high inflation, which occurred as economies re-opened following Covid, central bankers raised interest rates from rock-bottom levels. Gilts are negatively affected by rate rises because bond prices and yields move in opposite directions.
Index-linked gilts, which are UK government bonds that provide a route to gaining income that rises in line with price increases, have very long maturity dates as they are generally sold to professional investors, such as pension funds, which need to calculate and match their liabilities and assets well into the future.
Political changes also negatively impacted the gilt market, with rising government debt undermining confidence in the UK Treasury. Plans from then-prime minister Liz Truss to cut taxes and increase spending, despite a growing budget deficit problem, also exacerbated the gilt market sell-off.
European funds also outperform the UK
European funds outpaced UK funds, as the table below shows.
| Investment Association (IA) fund sector | 10-year return |
| Europe Excluding UK | 160.9% |
| Europe Including UK | 146.5% |
| European Smaller Companies | 120.8% |
Data from 24 June 2016 to 23 June 2026. Sourced from FE Analytics. Past performance is not a guide to future performance.
European funds were also unpopular following the referendum vote. Figures from the IA show that more investor money exited the sector than was invested from June 2016 to February 2017. Overall, it is a sector that rarely tops the sales charts. One reason, perhaps, is the lack of technology companies listed in the region compared to the US market.
Stock pickers running a European mandate, often point out that the region has lots of global leaders in their fields, or niche industries. Approximately 50% of revenues for European-listed companies comes from outside the region.
Top performers over this period include WS Ardtur Continental European, Liontrust European Dynamic and Artemis SmartGARP European Equity, with respective gains of 314.1%, 307.4% and 290.2%.
These articles are provided for information purposes only. Occasionally, an opinion about whether to buy or sell a specific investment may be provided by third parties. The content is not intended to be a personal recommendation to buy or sell any financial instrument or product, or to adopt any investment strategy as it is not provided based on an assessment of your investing knowledge and experience, your financial situation or your investment objectives. The value of your investments, and the income derived from them, may go down as well as up. You may not get back all the money that you invest. The investments referred to in this article may not be suitable for all investors, and if in doubt, an investor should seek advice from a qualified investment adviser.
Full performance can be found on the company or index summary page on the interactive investor website. Simply click on the company's or index name highlighted in the article.