Analysis: FTSE 1OO and S&P 500
Our chartist examines indices both here and over the pond. Find out why he's not 'oozing optimism'.
12th July 2019 09:26
by Alistair Strang from Trends and Targets
Our chartist examines indices both here and over the pond. Find out why he's not 'oozing optimism'.

FTSE for Friday & S&P 500 too
The 'damage' enacted by Trump's presidency continues to wreak havoc on US markets with the S&P now stronger than ever before. So are the Dow Jones and Nasdaq!
It makes a painful contrast with the UK's "strong and stable" rhetoric while the FTSE 100 index struggles to reach any realistic growth levels.
Maybe we need to build yet another wall to keep Scots out, because some ideas work in unexpected ways...
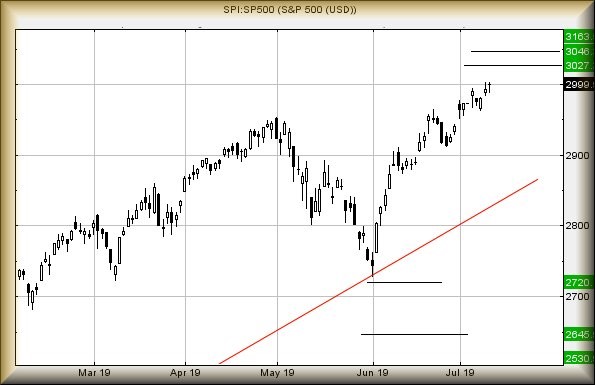
The S&P now needs better 3,003 to enter a cycle toward 3,027 points next, perhaps even 3,046 points thanks to all the opening movement gaps.
Longer-term, the index now looks capable of 3,163 as the next major point of interest. The market needs to fall below 2,875 to indicate the rising phase is starting to fail.
Source: Trends and Targets Past performance is not a guide to future performance
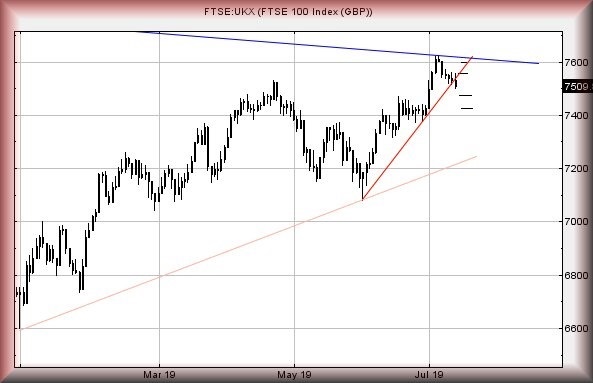
As for the FTSE and Friday, as mentioned earlier, the index continues to behave poorly and weakness now below 7,500 looks capable of a near-term 7,473 points.
If broken, secondary is at 7,424 points and we'd hope for a rebound at such a level. If triggered, the tightest visual stop is at 7,532 points but realistically, we'd prefer 7,560 as this one appears too much like a free gift.
The converse situation, what happens if the index betters 7,532 is pretty straightforward. Initially we'd look for some recovery to 7,558 points. Secondary, if bettered, calculates at 7,598 points.
We're not oozing optimism, given the UK market managed to close below its immediate uptrend. Equally, if we applied similar acceleration force to those experienced in the USA, the UK should be trading around 7,750 at present.
Source: Trends and Targets Past performance is not a guide to future performance
Alistair Strang has led high-profile and "top secret" software projects since the late 1970s and won the original John Logie Baird Award for inventors and innovators. After the financial crash, he wanted to know "how it worked" with a view to mimicking existing trading formulas and predicting what was coming next. His results speak for themselves as he continually refines the methodology.
Alistair Strang is a freelance contributor and not a direct employee of Interactive Investor. All correspondence is with Alistair Strang, who for these purposes is deemed a third-party supplier. Buying, selling and investing in shares is not without risk. Market and company movement will affect your performance and you may get back less than you invest. Neither Alistair Strang or Interactive Investor will be responsible for any losses that may be incurred as a result of following a trading idea.
These articles are provided for information purposes only. Occasionally, an opinion about whether to buy or sell a specific investment may be provided by third parties. The content is not intended to be a personal recommendation to buy or sell any financial instrument or product, or to adopt any investment strategy as it is not provided based on an assessment of your investing knowledge and experience, your financial situation or your investment objectives. The value of your investments, and the income derived from them, may go down as well as up. You may not get back all the money that you invest. The investments referred to in this article may not be suitable for all investors, and if in doubt, an investor should seek advice from a qualified investment adviser.
Full performance can be found on the company or index summary page on the interactive investor website. Simply click on the company's or index name highlighted in the article.