Chart of the week: A blue chip to buy or sell?
23rd July 2018 12:03
by John Burford from interactive investor
Share on
Markets flag changing trends before most are aware of it. Chartist John Burford tells us what this share price is saying.

This is one of Britain's oldest property companies and is a core holding among many investment groups and funds. But is it worth holding now for the private investor? Of course, most funds are pretty much married to the current 4.7% dividend yield and will continue to hold through thick and thin – and the share price plunge of 40% between 2015 and 2016 was certainly on the thin side.
Can we expect some similar thin times for this year – and next?
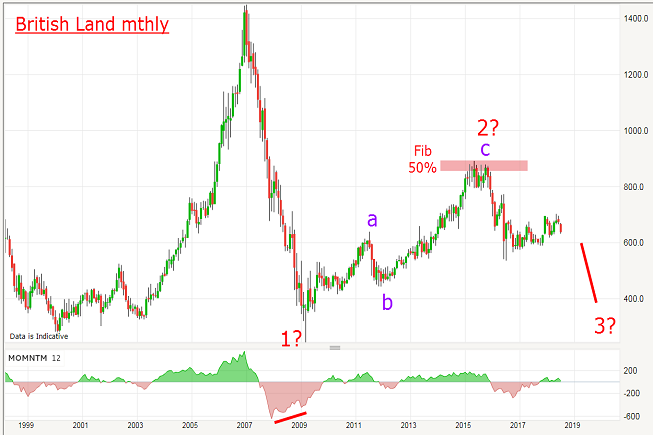
The share prices of our domestic property companies depend heavily on the state of the local property markets in the UK, of course. The Credit Crunch of 2007 – 2009 devastated many such companies as property values plunged. Here is the British Land Co chart from 1999:
Source: interactive investor Past performance is not a guide to future performance
For followers of the Elliott Wave theory, this chart is a textbook case of five up to the 2007 high at £14.50 and a five down to the post Credit Crunch 2009 low at £2.44 for a staggering loss of 83%. That march up and then down is what I call a Grand Old Duke of York pattern. Who said property investment trusts were boring?
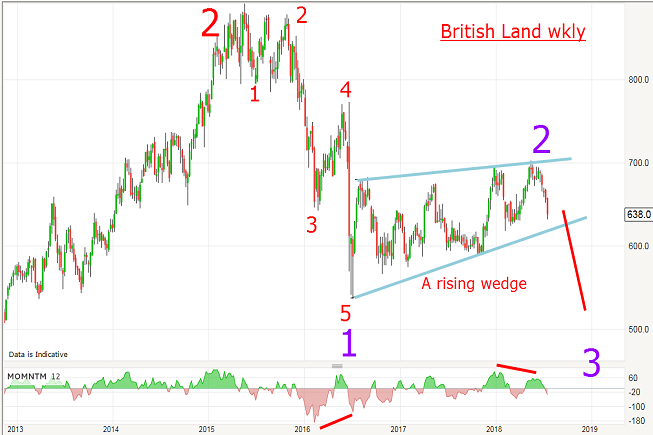
But since the 2009 low, shares have recovered somewhat but to me, appear vulnerable to a resumption of the sell-off. This is my reading of the weekly chart of the recent period off the wave 2 high of March 2015:
Source: interactive investor Past performance is not a guide to future performance
The rally carried to the precise Fibonacci 50% retrace of the entire move down off the 2007 high, which is a typical turning point. And the decline off that high is a clear impulsive five down that took it to the July 2016 wave 5 low at £5.36. And that produced a solid momentum divergence (red bar) that heralded a decent recovery phase.
And this is precisely what has transpired – but note the waves of the past two years have been highly overlapping, and that strongly suggests a corrective behaviour (main trend down), not an impulsive one (main trend up).
But when the market rallied to the £7 level in late May on a momentum divergence and began a strong move down, I had my purple wave 2 high in place and could project the shares were at the start of a third wave down. And third waves are usually the strongest of all.
To my mind, the weak recovery off the 2016 lows is somewhat surprising as property has been pretty buoyant – until recently, that is. But now with the retail sector’s difficulties reaching the headlines, perhaps that weak recovery in BLND was telling us something months ago. After all, that’s what markets do. They flag changing trends before most are aware of it. It’s the Wisdom of Crowds effect at work.
I expect the lower wedge line to be broken in due course and a move to the £5 area is not out of the question this summer.
John Burford is the author of the definitive text on his trading method, Tramline Trading. He is also a freelance contributor and not a direct employee of interactive investor.
These articles are provided for information purposes only. Occasionally, an opinion about whether to buy or sell a specific investment may be provided by third parties. The content is not intended to be a personal recommendation to buy or sell any financial instrument or product, or to adopt any investment strategy as it is not provided based on an assessment of your investing knowledge and experience, your financial situation or your investment objectives. The value of your investments, and the income derived from them, may go down as well as up. You may not get back all the money that you invest. The investments referred to in this article may not be suitable for all investors, and if in doubt, an investor should seek advice from a qualified investment adviser.
Full performance can be found on the company or index summary page on the interactive investor website. Simply click on the company's or index name highlighted in the article.
Disclosure
We use a combination of fundamental and technical analysis in forming our view as to the valuation and prospects of an investment. Where relevant we have set out those particular matters we think are important in the above article, but further detail can be found here.
Please note that our article on this investment should not be considered to be a regular publication.
Details of all recommendations issued by ii during the previous 12-month period can be found here.
ii adheres to a strict code of conduct. Contributors may hold shares or have other interests in companies included in these portfolios, which could create a conflict of interests. Contributors intending to write about any financial instruments in which they have an interest are required to disclose such interest to ii and in the article itself. ii will at all times consider whether such interest impairs the objectivity of the recommendation.
In addition, individuals involved in the production of investment articles are subject to a personal account dealing restriction, which prevents them from placing a transaction in the specified instrument(s) for a period before and for five working days after such publication. This is to avoid personal interests conflicting with the interests of the recipients of those investment articles.