Chart of the week: Is FTSE 100 really oversold?
18th September 2018 11:46
by John Burford from interactive investor
Share on
Technical analyst John Burford cuts through the noise and reveals the direction he believes equity markets are heading in the next few weeks.

FTSE hits my targets
I thought I would briefly cover the FTSE 100 today as it has declined to an important downside target of mine I have had in place to a few weeks.
Many have been puzzled by its performance recently, but for followers of Elliott Wave Theory - and who pay close attention to Fibonacci retracements - there should be little to puzzle at all.
For perspective, here is the multi-year monthly chart from 1999:
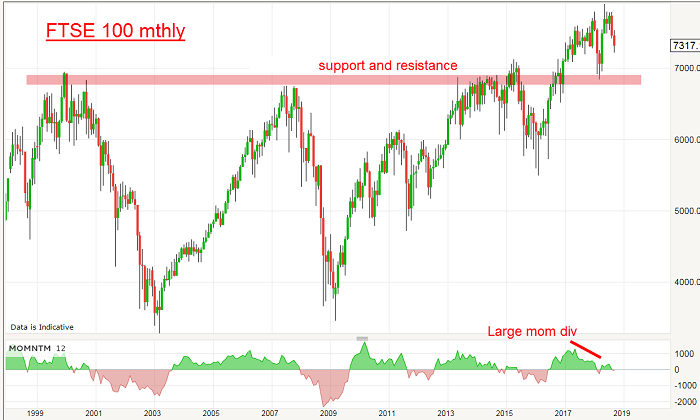
Source: interactive investor Past performance is not a guide to future performance
What terrific waves! And a long-term trader's dream – up until the Credit Crunch low of 2009, that is. The waves then took on a highly ambiguous tone. But the major point I want to stress is the move to new all-time highs last year. That took it well above the pink area of resistance which had held all previous rally attempts. The 6,800 area is a significant price level.
Many pundits turned very bullish on that event of course, and I was seeing projections to the 9,000 area commonly touted.
But, as is usual in these circumstances, the market had other ideas and promptly fell had back down to the pink zone. And as a demonstration of the strength of the support there, the market zipped right back up again. Naturally, that was an excellent area to place buy orders using close stops. But note the large momentum divergence at the recent high – a clear warning to expect a decent corrective phase ahead.
Here is a close-up of recent action on the weekly chart:

Source: interactive investor Past performance is not a guide to future performance
The clear five waves up to the recent 7,903 high is another signal to expect a correction – and that indeed is what we are in.
A typical correction is a wave with three internal waves and we have one working now. Here is a close-up of action off the high on the daily chart:
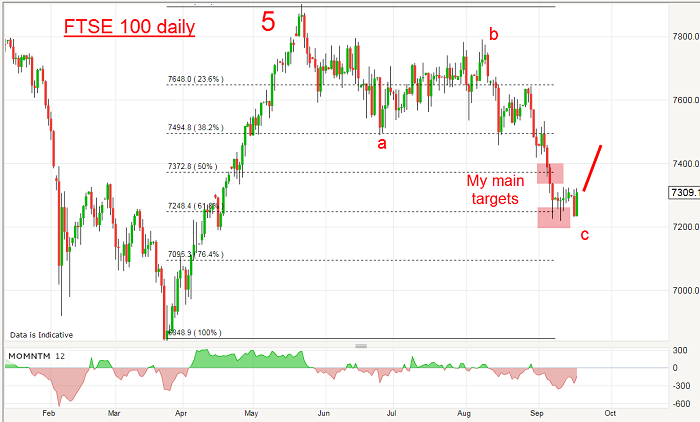
Source: interactive investor Past performance is not a guide to future performance
The decline is clearly a three and, as the wave 5 was put in, I established my immediate targets at the Fib 50% (around 7,350) and then the Fib 62% at around the 7,250 region, which it has just hit.
Now the market is poised to bounce up off an oversold condition and my forecast upper target is the 7,500 area.
But after that? It is unlikely the current decline is the entirety of the correction as it has only spanned a few months, but at least I have a short-term plan for my trades.
John Burford is the author of the definitive text on his trading method, Tramline Trading. He is also a freelance contributor and not a direct employee of interactive investor.
These articles are provided for information purposes only. Occasionally, an opinion about whether to buy or sell a specific investment may be provided by third parties. The content is not intended to be a personal recommendation to buy or sell any financial instrument or product, or to adopt any investment strategy as it is not provided based on an assessment of your investing knowledge and experience, your financial situation or your investment objectives. The value of your investments, and the income derived from them, may go down as well as up. You may not get back all the money that you invest. The investments referred to in this article may not be suitable for all investors, and if in doubt, an investor should seek advice from a qualified investment adviser.
Full performance can be found on the company or index summary page on the interactive investor website. Simply click on the company's or index name highlighted in the article.
Disclosure
We use a combination of fundamental and technical analysis in forming our view as to the valuation and prospects of an investment. Where relevant we have set out those particular matters we think are important in the above article, but further detail can be found here.
Please note that our article on this investment should not be considered to be a regular publication.
Details of all recommendations issued by ii during the previous 12-month period can be found here.
ii adheres to a strict code of conduct. Contributors may hold shares or have other interests in companies included in these portfolios, which could create a conflict of interests. Contributors intending to write about any financial instruments in which they have an interest are required to disclose such interest to ii and in the article itself. ii will at all times consider whether such interest impairs the objectivity of the recommendation.
In addition, individuals involved in the production of investment articles are subject to a personal account dealing restriction, which prevents them from placing a transaction in the specified instrument(s) for a period before and for five working days after such publication. This is to avoid personal interests conflicting with the interests of the recipients of those investment articles.