Chart of the week: FTSE at the crossroads
As market jitters grow, technical analyst John Burford looks at where the FTSE 100 might end up.
19th August 2019 12:23
by John Burford from interactive investor
Share on
As market jitters grow, technical analyst John Burford looks at where the FTSE 100 might end up.

I thought I would update my FTSE 100 coverage since I believe it is at a critical juncture following sharp falls this month. Fear is definitely in the air with global economic data coming in weak with the German powerhouse – as well as China – slowing at a rate of knots.
But of course, we all know the stock market is not the economy! As we have repeatedly seen since 2008, bad news is often great news for shares since it bolsters the case for a lowering of interest rates to 'support' the economy. And since much of the advance of the S&P in recent years especially has been down to record levels of stock buy-backs, a lower interest rate encourages more of the same.
At least that is the current theory, but with yield inversions and much sovereign debt at negative yield, we are most certainly in uncharted territory. Old certainties are no longer dead certs.
Obviously, any impediment to the growth of the gargantuan US stock buy-back programmes would likely send shivers around the c-suites of the tech high flyers. For example, a ‘surprise’ increase in rates (coming sooner than most think), or a downturn in sales. Or better yet, a peer into the future.
Of course, FTSE companies are not as exposed to this as in the United States, but a downward shift in sentiment there would instantly flow over to this side of the pond.
So where are we in the big picture? Here is the weekly FTSE chart going back to the 2016 low.
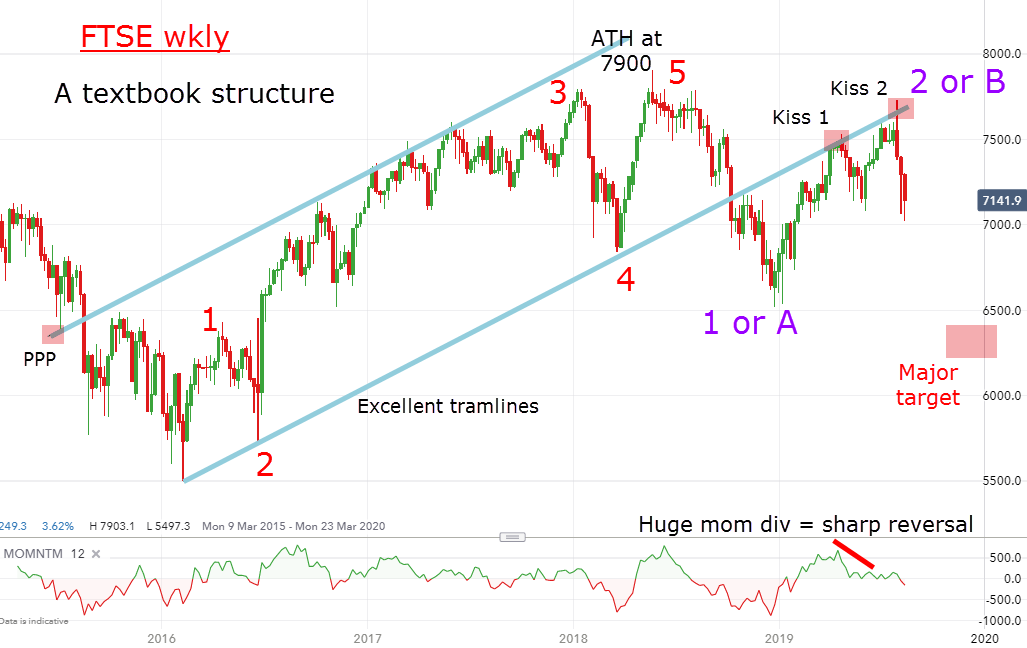
Source: interactive investor Past performance is not a guide to future performance
In fact, this chart has everything – great tramlines, textbook Elliott waves and even Fibonacci relationships (not shown); all three elements of my Tramline method.
When the market poked above the old wave 3 high on 23 May this year, I could then label the five wave move off the 2016 low as potentially complete – and thus I could begin to think in terms of a major reversal down that could last for many months.
And the hard declines following the all time high certainly backed up this idea. When the market broke hard below the lower tramline last October, I felt sure that any subsequent rally would be counter-trend. A textbook recovery to kiss the lower tramline would be just the ticket.
Here is that rally on the daily chart:
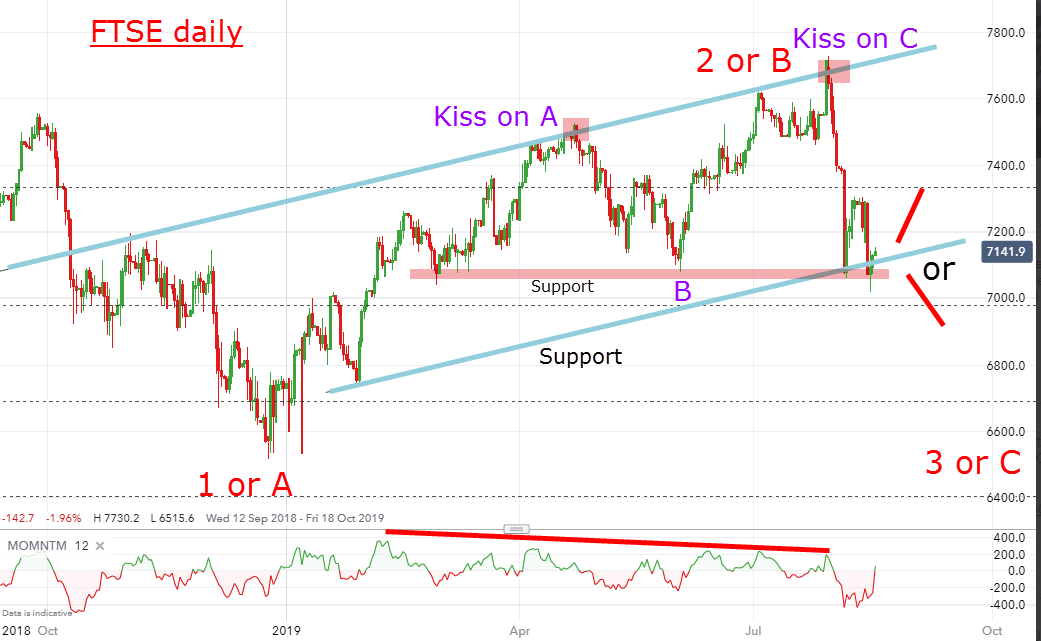
Source: interactive investor Past performance is not a guide to future performance
Indeed, my wish was answered and note that both kisses heralded Scalded Cat Bounces with the latest being especially sharp. So now the market is testing my lower blue tramline support and at the moment of truth. Needless to say, I like kisses! They are low risk opportunities for precision timing of trade entries.
Near-term, odds slightly favour a rally phase this week to perhaps the 7,360 area. But a hard break of the 7,100 region would set the market lower in either a third or a C wave – either of which could be devastating – and set up my main first target at the 6,300 area.
Finally, here is an idea: If sterling can stage a decent rally from its currently oversold position (serious UK/EU Brexit talks, anyone?), the pressure on the FTSE would be strong.
For more information about Tramline Traders, or to take a three-week free trial, go to www.tramlinetraders.com.
John Burford is the author of the definitive text on his trading method, Tramline Trading. He is also a freelance contributor and not a direct employee of interactive investor.
These articles are provided for information purposes only. Occasionally, an opinion about whether to buy or sell a specific investment may be provided by third parties. The content is not intended to be a personal recommendation to buy or sell any financial instrument or product, or to adopt any investment strategy as it is not provided based on an assessment of your investing knowledge and experience, your financial situation or your investment objectives. The value of your investments, and the income derived from them, may go down as well as up. You may not get back all the money that you invest. The investments referred to in this article may not be suitable for all investors, and if in doubt, an investor should seek advice from a qualified investment adviser.
Full performance can be found on the company or index summary page on the interactive investor website. Simply click on the company's or index name highlighted in the article.
Disclosure
We use a combination of fundamental and technical analysis in forming our view as to the valuation and prospects of an investment. Where relevant we have set out those particular matters we think are important in the above article, but further detail can be found here.
Please note that our article on this investment should not be considered to be a regular publication.
Details of all recommendations issued by ii during the previous 12-month period can be found here.
ii adheres to a strict code of conduct. Contributors may hold shares or have other interests in companies included in these portfolios, which could create a conflict of interests. Contributors intending to write about any financial instruments in which they have an interest are required to disclose such interest to ii and in the article itself. ii will at all times consider whether such interest impairs the objectivity of the recommendation.
In addition, individuals involved in the production of investment articles are subject to a personal account dealing restriction, which prevents them from placing a transaction in the specified instrument(s) for a period before and for five working days after such publication. This is to avoid personal interests conflicting with the interests of the recipients of those investment articles.