Chart(s) of the week: Facebook, Twitter and Snap
1st October 2018 10:29
by John Burford from interactive investor
Share on
With three of the world's biggest tech companies all hitting trouble, technical analyst John Burford predicts some big price moves ahead.

Have the social media giants had their day?
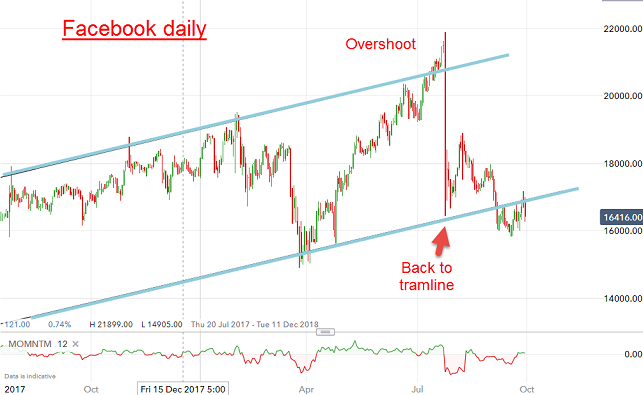
In the blink of an eye (in four hours, in fact) on 25 July, Facebook shares plunged from their all-time high at $220 to $165 – a stunning collapse of 25% (the Facebook Flame-out). And they have not recovered in the intervening two months despite a couple of attempts to rally. They trade at the $165 area today.
So, was this sudden collapse foreseeable? According to my methods of analysis, the answer is 'kinda'.
Source: interactive investor Past performance is not a guide to future performance
The daily chart shows the share price had been climbing in the trading channel between my excellent tramlines with the upper line in effect since 2013. This unusually long-lived line of resistance was therefore proved to be of major time-tested significance.
And in July, the market broke clear above it – a significant event (once in five years!). Most would take that as bullish, but it set up the possibility for an ‘overshoot’ or a buying climax provided the market fell back below the tramline.
And on that fateful day on the 25th, that is precisely what happened and that one event ensured a rapid descent back to the lower tramline. In fact, this was a textbook example of a selling climax. But sadly, it was so swift, very few traders could have taken advantage.
When I saw that collapse, I knew the social media sector was in big trouble.
Of course, signs of looming crisis were not exactly invisible – regulators were breathing hot and heavy about the more negative aspects with threats of regulation, and I noted more mainstream media pieces detailing the harm it’s doing to youngsters. The mood was certainly changing and it was only a matter of time before the share prices reflected that new reality.
So today I thought I would cover two of the smaller giants - Snap and Twitter - and see if their charts reflect the more negative mood.
Source: interactive investor Past performance is not a guide to future performance
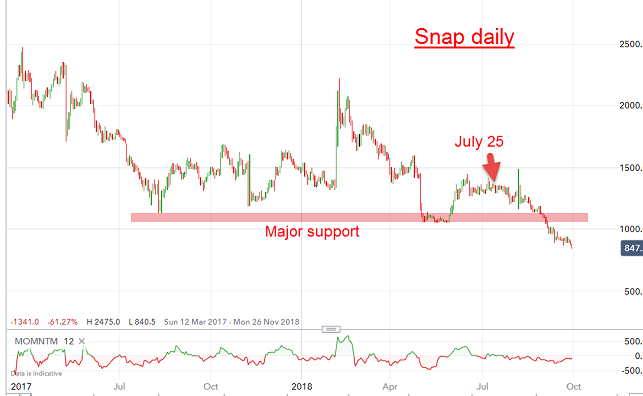
Snap had its IPO in March 2017 at $17 a share and quickly rose to a high of $28 right after launch. But from then, it has been downhill all the way with one brief sharp rally in February.
But declines were held at the $12 area for many months with this level thus representing major support.
Sadly for the bulls, that significant level was recently breached and the shares are currently trading around lows at the $8.50 level.
With its own bear market having started only hours after IPO launch in March 2017, was SNAP leading the way down for the entire social media sector? Was it yet another bubble?
Source: interactive investor Past performance is not a guide to future performance
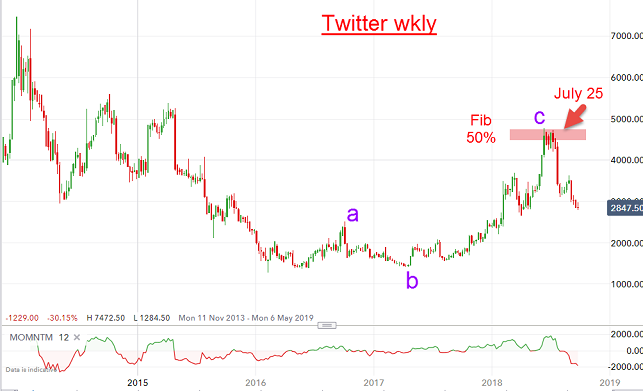
As a longer-established platform, Twitter has a more developed chart. It launched in November 2013 at $26 and in common with tech IPOs at the time, quickly rallied to its $75 high a few days after launch. And that was its all-time high. It has been downhill ever since.
And after a three-year bear, it staged a rally phase, but note its corrective nature in three waves with the b wave sporting a three down and the c wave a five.
And the c wave terminated (within hours of the Facebook Flame-out) at the conventional Fibonacci 50% retrace of the entire bear. That was superb short opportunity.
In recent weeks, the decline has resumed with a vengeance with the shares losing 40% off the July peaks. If my labels are correct, I expect a break of the old $14 lows at some stage.
Taken together with Facebook, the two share patterns above offer little comfort for the bulls and I expect bear trends to continue, albeit punctuated by occasional bear market rallies.
From a trading standpoint, shorting rallies is the preferred strategy.
For me, the big problem with tech shares in general is that they are vulnerable to another 'big idea' platform coming along that makes them semi-redundant. Also, valuations are sky high making them vulnerable to re-rating.
John Burford is the author of the definitive text on his trading method, Tramline Trading. He is also a freelance contributor and not a direct employee of interactive investor.
These articles are provided for information purposes only. Occasionally, an opinion about whether to buy or sell a specific investment may be provided by third parties. The content is not intended to be a personal recommendation to buy or sell any financial instrument or product, or to adopt any investment strategy as it is not provided based on an assessment of your investing knowledge and experience, your financial situation or your investment objectives. The value of your investments, and the income derived from them, may go down as well as up. You may not get back all the money that you invest. The investments referred to in this article may not be suitable for all investors, and if in doubt, an investor should seek advice from a qualified investment adviser.
Full performance can be found on the company or index summary page on the interactive investor website. Simply click on the company's or index name highlighted in the article.
Disclosure
We use a combination of fundamental and technical analysis in forming our view as to the valuation and prospects of an investment. Where relevant we have set out those particular matters we think are important in the above article, but further detail can be found here.
Please note that our article on this investment should not be considered to be a regular publication.
Details of all recommendations issued by ii during the previous 12-month period can be found here.
ii adheres to a strict code of conduct. Contributors may hold shares or have other interests in companies included in these portfolios, which could create a conflict of interests. Contributors intending to write about any financial instruments in which they have an interest are required to disclose such interest to ii and in the article itself. ii will at all times consider whether such interest impairs the objectivity of the recommendation.
In addition, individuals involved in the production of investment articles are subject to a personal account dealing restriction, which prevents them from placing a transaction in the specified instrument(s) for a period before and for five working days after such publication. This is to avoid personal interests conflicting with the interests of the recipients of those investment articles.