The simple secret to spotting stockmarket trends
28th December 2018 13:12
by Alistair Strang from Trends and Targets
Award-winning software expert and technical analyst Alistair Strang reveals how he makes so many correct calls on stock, indices and other market trends.

Alistair Strang has led high-profile and "top secret" software projects since the late 1970s and won the original John Logie Baird Award for inventors and innovators. After the financial crash, he wanted to know "how it worked" with a view to mimicking existing trading formulas and predicting what was coming next. His results speak for themselves as he continually refines the methodology.
The 'Target Met' story
Folk who follow our daily articles will be aware of our fondness for 'Target Me'. Despite the massive number of occasions this preface appears, it has absolutely nothing to do with self-aggrandisement, self-promotion, nor our ego.
We don't slavishly follow every prediction, agonising over market movements while crossing fingers in hope. Instead, we glance at a report and, if a target is met, it forces a rerun of the numbers.
Simply put, if a trend has changed, we need to know as a new set of trigger levels is required. Writing 'Target Met' – we've done it 756 times in 2018 - is our shorthand reminder!
How we got bitcoin right
Bitcoin's price collapse was a recent case in point, if we can call a 'recent case' being one first warned of seven months ago.
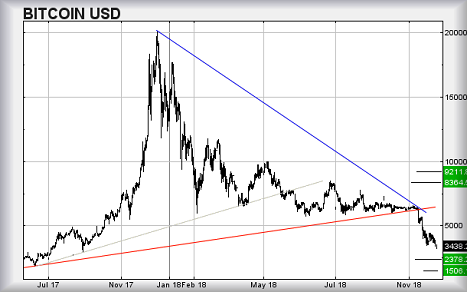
Source: Trends and Targets Past performance is not a guide to future performance
The cyptocurrency triggered a drop from $6,200 down to $5,400 initially back in May.
The only problem evident for the next six months was pretty plain to all observers. It didn't actually drop further, aside from a few irrational intraday movements!
Neither did bitcoin recover by any substance. From our perspective, it had triggered a drop to $5,400 and, thus, could not be trusted.
Of course, the interesting thing was to be price movements once our 'Target Met' appeared. The crypto actually hit $5,409 and bounced a little bit. This proved quite reassuringly we’d been calculating against the correct trend.
We've never hidden our utter distrust of bitcoin movements. Basically, the entire market took the aspect of a ramped AIM or FTSE 100 share on board and, from the point it broke below $6,200 in May, it was going to drop severely, perhaps collapse.
We'd given a secondary below the $5,400 level and this was at $3,900.
This secondary has been broken and despite some surprise recovery, we now regard it as heading to somewhere around $2,400 next – perhaps substantially worse. Essentially, bitcoin has become damaged goods, requiring a miracle.
The bitcoin argument has echoes with FTSE, Brent and US crude price movements. In addition, UK currency movements against the US dollar and the euro are proving devastatingly accurate.
How do we achieve this?
Our secret is simple.
We utterly ignore sentiment, internet gossip, and even fundamentals which are the other key indicator for price movements. Our approach is essentially; "if I were computer software, what would I do next?"
Since 2003, when Singapore's stockmarket became the final link in a world-wide chain of markets driven by software, the majority of price movements utterly remove human beings from the equation.
As a result, things like Moving Averages, Fibonaccis, Stochastics, MacD, Candlesticks, were consigned to the dustbin of history, along with pocket calculators, the ability of market commentators to get things right, and reliable Google search results.
Remember, fundamentals really matter but, equally, where are fundamentals with bitcoin?
Our Vodafone call was spookily accurate
Back in November 2016, we mentioned a price which would be hit with incredible accuracy two years later! Here’s a snip from that article which you can read here in full:
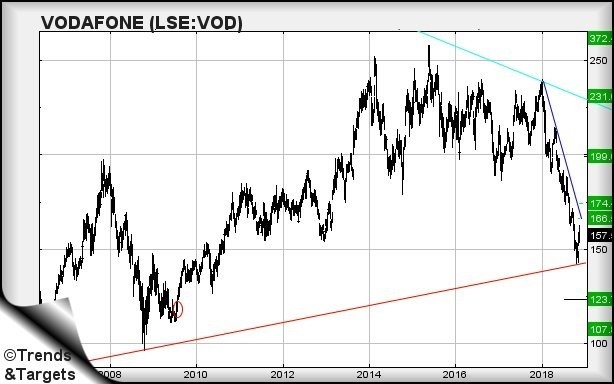
Vodafone has been getting a bit of a hammering recently and we're loath to call it "cheap", despite the share closing the session at 200.875p mid-price. The share suffers from a 'red' line (see chart below) and currently it's at 202.504p, with the price now closing a session below this uptrend since 2009.
The scenario now exists of weakness below 199p triggering further painful reversals, as 194p looks probable, but, realistically we're looking hard at 180p as a potential bounce point.
The problem with this tableau of misery is it takes the price into a region where negative news could easily drop the price to 142p which challenges an uptrend since 1996!
Vodafone's share price bottomed at 142.6p on 26 October 2018. It has since bounced as high as 171p. And, again, 171p is a target level set by us. Here’s a snip from that article which you can read here in full:
At present, this perfectly defined line [the immediate blue downtrend] is at 171p and we'd suspect it shall prove a hindrance in any rise. Only with closure above blue dare we express longer-term optimism as there's plenty of strength to force some decent rises.
Read here to find out what might happen next:
Source: Trends and Targets Past performance is not a guide to future performance
Alistair Strang is a freelance contributor and not a direct employee of Interactive Investor. All correspondence is with Alistair Strang, who for these purposes is deemed a third-party supplier. Buying, selling and investing in shares is not without risk. Market and company movement will affect your performance and you may get back less than you invest. Neither Alistair Strang, or interactive investor will be responsible for any losses that may be incurred as a result of following a trading idea.
Alistair Strang has led high-profile and "top secret" software projects since the late 1970s and won the original John Logie Baird Award for inventors and innovators. After the financial crash, he wanted to know "how it worked" with a view to mimicking existing trading formulas and predicting what was coming next. His results speak for themselves as he continually refines the methodology.
Alistair Strang is a freelance contributor and not a direct employee of Interactive Investor. All correspondence is with Alistair Strang, who for these purposes is deemed a third-party supplier. Buying, selling and investing in shares is not without risk. Market and company movement will affect your performance and you may get back less than you invest. Neither Alistair Strang or Interactive Investor will be responsible for any losses that may be incurred as a result of following a trading idea.
These articles are provided for information purposes only. Occasionally, an opinion about whether to buy or sell a specific investment may be provided by third parties. The content is not intended to be a personal recommendation to buy or sell any financial instrument or product, or to adopt any investment strategy as it is not provided based on an assessment of your investing knowledge and experience, your financial situation or your investment objectives. The value of your investments, and the income derived from them, may go down as well as up. You may not get back all the money that you invest. The investments referred to in this article may not be suitable for all investors, and if in doubt, an investor should seek advice from a qualified investment adviser.
Full performance can be found on the company or index summary page on the interactive investor website. Simply click on the company's or index name highlighted in the article.