What we've learnt about the FTSE 100 this week
After a tricky start, the main index has rallied, but it can't afford a repeat, warns our chartist.
7th June 2019 08:38
by Alistair Strang from Trends and Targets
After a tricky start, the main index has rallied, but it can't afford a repeat, warns our chartist.

FTSE for FRIDAY (FTSE:UKX)
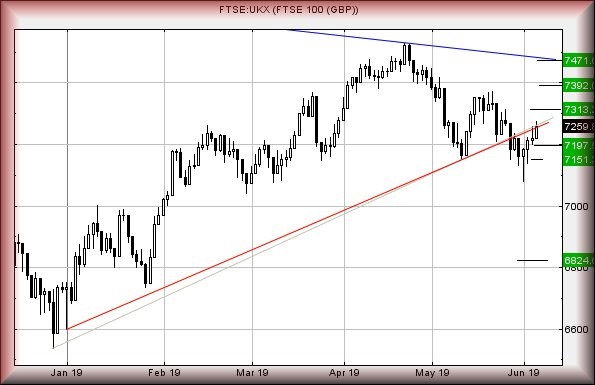
With an interesting level of discretion, the FTSE 100 index has spent the last week scaring us silly! The problem was fairly simple. The market had broken the red line on the chart below, moving the index into the land of pestilence, famine, dinosaurs, and rabid politicians. And then it changed...
Our thinking last week suggested a drop coming to 7,106 points, something the market actually achieved on the Monday. Worse, it even broke below this level, eventually opting to rebound from 7,079 points.
The entire charade of reversals was played out in just 46 minutes, after the market opened for trading. In the week since, continued small daily gains now make us wonder if the FTSE just did a "gotcha" on those folk taking short positions, once they've assessed the competence of our countries leadership. The point at which the FTSE closed the day on Friday has tended, if we apply our usual logic, to spoil any immediate drop potential.
Here's the thing - to quote Simon Cowell. (when he struggles to find new ways to avoid saying "deluded")
The red line on the chart, the uptrend since the start of January, is presently at 7,250 points.
Alternately, the trend from the market lows of December 2018 is presently at 7,258 points.
The FTSE closed Thursday at 7,259 points.
If the market were a share, we'd be inclined to regard the drop to 7,079 points on Monday as "fake" and instead, opt to take a more optimistic view for immediate future.
Near term, FTSE movements above 7,285 should attempt recovery to an initial 7,313 points. Our secondary, if bettered, calculates at 7,392 points and given the pace of market movement recently, it's unlikely to come along at a rush. The tightest stop loss level appears to be pretty wide at 7,228 points.
There are some interesting potentials if 7,228 breaks at travel down to 7,197 appears likely. If broken, secondary is at 7,151 points.
Finally, there is a further important facet of the recent drop to 7,107. The market proved the ruling uptrend can be broken, meaning any future break below 7,107 is liable to promote a swift, almost 300-point, drop to the 6,800's.
Have a good weekend; it's the Montreal F1 Weekend and almost time for Ferrari to ritually humiliate themselves again.
Source: Trends and Targets Past performance is not a guide to future performance
Alistair Strang has led high-profile and "top secret" software projects since the late 1970s and won the original John Logie Baird Award for inventors and innovators. After the financial crash, he wanted to know "how it worked" with a view to mimicking existing trading formulas and predicting what was coming next. His results speak for themselves as he continually refines the methodology.
Alistair Strang is a freelance contributor and not a direct employee of Interactive Investor. All correspondence is with Alistair Strang, who for these purposes is deemed a third-party supplier. Buying, selling and investing in shares is not without risk. Market and company movement will affect your performance and you may get back less than you invest. Neither Alistair Strang or Interactive Investor will be responsible for any losses that may be incurred as a result of following a trading idea.
These articles are provided for information purposes only. Occasionally, an opinion about whether to buy or sell a specific investment may be provided by third parties. The content is not intended to be a personal recommendation to buy or sell any financial instrument or product, or to adopt any investment strategy as it is not provided based on an assessment of your investing knowledge and experience, your financial situation or your investment objectives. The value of your investments, and the income derived from them, may go down as well as up. You may not get back all the money that you invest. The investments referred to in this article may not be suitable for all investors, and if in doubt, an investor should seek advice from a qualified investment adviser.
Full performance can be found on the company or index summary page on the interactive investor website. Simply click on the company's or index name highlighted in the article.