Chart of the week: Proof that you can predict a market top
5th November 2018 14:26
by John Burford from interactive investor
Share on
Technical analyst John Burford references a harsh lesson handed to investors 400 years ago to plot the next 'devastating' trend for Amazon stock.

Amazon sells tulips
With many of the formerly high-flying US Tech Titans suddenly falling off their perches, many investors are puzzling why that category-crusher Amazon.com is not still shooting for the moon. After all, we hear almost daily of the 'Amazon Effect' that is said to be destroying our high streets and cutting a swathe through our retails giants especially.
As I keep repeating ad nauseam, share markets always top out when the future appears wonderful to the majority – and with the constant media coverage of the Amazon Effect (as the TV cameras pan the almost-deserted Highs Streets, save for the charity shops and bookies), the message is being rammed home with force.
Yes, AMZ appeared invincible and the shares were destined to keep shooting for the moon as it is now set to conquer home food delivery and pressure the supermarkets. Or is it?
Bullish sentiment has certainly been riding high - and this is my ideal hunting ground for a major top. Many say they are contrarians but in reality, a true contrarian must have a time-tested strategy and only go against the crowd when the timing is pin-point perfect. Otherwise, you may be caught in another upward lurch – and that is painful, as Tesla shorts are now discovering.
Incidentally, I refuse to trade Tesla as it is the most heavily shorted on the board and subject to massive manipulation (Mr Musk is a prime offender).
I like to show this Amazon chart as an example when a mania gets out of hand and blows its top:
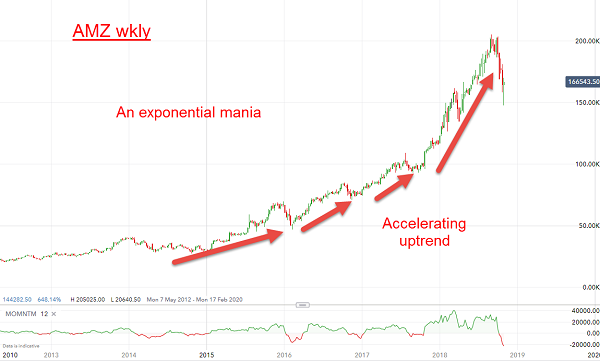
Source: interactive investor Past performance is not a guide to future performance
Does this chart remind you of anything? Perhaps this:
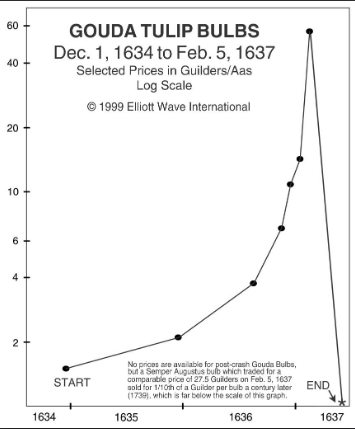
Yes, I thought so – the famous accelerating uptrending Tulipomania chart from the 17th Century! Note the final bust ended lower that that at the start of the mania – a very typical path for most manias (AMZ investors beware!).
And in a supreme irony, Amazon does sell tulips (even fake ones, but cheaper than those earlier!) And they have at least one thing in common – the speculation in both was purely about future price appreciation (in modern parlance 'momentum-chasing'). So after almost 400 years, some things don't change, especially in the matter of human nature.
I had been following the progress of my pink ending diagonal (a pattern that is valid only when at the end of a very long trend) and with the break down on 5 October, that was my sell signal.
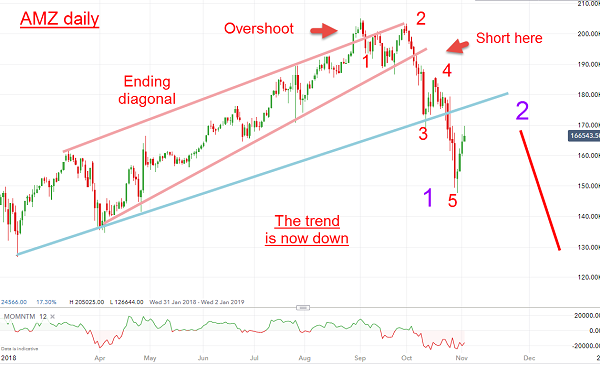
Source: interactive investor Past performance is not a guide to future performance
Loyal readers will know that I make a speciality of detecting trend changes (in real time) using my Tramline Trading methods. Of course, this is in violation of the oft-stated mantra from pundits that it is impossible to time market tops and bottoms. I like a challenge!
Now, the plunge has occurred in a clear five-wave impulsive pattern - and that means the main trend is now down with high degree of confidence.
My guess is that the maximum upside for wave 2 is a kiss on the blue trendline, and then a devastating third wave down to mimic the path taken by those ancient Gouda tulips centuries ago.
John Burford is the author of the definitive text on his trading method, Tramline Trading. He is also a freelance contributor and not a direct employee of interactive investor.
These articles are provided for information purposes only. Occasionally, an opinion about whether to buy or sell a specific investment may be provided by third parties. The content is not intended to be a personal recommendation to buy or sell any financial instrument or product, or to adopt any investment strategy as it is not provided based on an assessment of your investing knowledge and experience, your financial situation or your investment objectives. The value of your investments, and the income derived from them, may go down as well as up. You may not get back all the money that you invest. The investments referred to in this article may not be suitable for all investors, and if in doubt, an investor should seek advice from a qualified investment adviser.
Full performance can be found on the company or index summary page on the interactive investor website. Simply click on the company's or index name highlighted in the article.
Disclosure
We use a combination of fundamental and technical analysis in forming our view as to the valuation and prospects of an investment. Where relevant we have set out those particular matters we think are important in the above article, but further detail can be found here.
Please note that our article on this investment should not be considered to be a regular publication.
Details of all recommendations issued by ii during the previous 12-month period can be found here.
ii adheres to a strict code of conduct. Contributors may hold shares or have other interests in companies included in these portfolios, which could create a conflict of interests. Contributors intending to write about any financial instruments in which they have an interest are required to disclose such interest to ii and in the article itself. ii will at all times consider whether such interest impairs the objectivity of the recommendation.
In addition, individuals involved in the production of investment articles are subject to a personal account dealing restriction, which prevents them from placing a transaction in the specified instrument(s) for a period before and for five working days after such publication. This is to avoid personal interests conflicting with the interests of the recipients of those investment articles.