FTSE 100: more misery to come for the index?
Yesterday's drop put the index in a less happy place. Our chartist studies where things could be heading.
25th September 2020 09:33
by Alistair Strang from Trends and Targets
Yesterday's drop put the index in a less happy place. Our chartist studies where things could be heading.
FTSE for Friday & GBP/USD
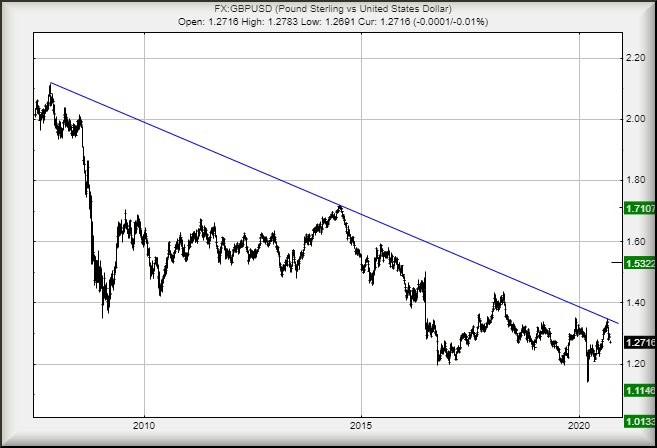
It's easy to think of sterling's woes as being a Brexit or Covid thing but the harsh reality of the decline in the pound’s strength dates back to 2007 and the start of the financial crash.
The chart below spells out this drama with painful clarity. Both GBP and USD failed to recover from the crash, steadily edging lower in the period since.
We've been predicting parity (or worse) for this pair, quite literally for years.
The market has proven fairly rigid, with its 13-year blue downtrend. A simple glance indicates the relationship requires to exceed $1.34 (£1.05) at present to suggest something game changing is happening.
Needless to say, we've our own collection of mumbo jumbo reasons to distrust something as obvious as a trend line.
Instead, we can calculate GBP/USD needs to be above $1.39 to cancel the chances of parity making an appearance eventually.
In such a miraculous event, we can point to recovery to $1.53 initially with secondary, if exceeded, an amazing-sounding $1.71.
The surprising thing about the secondary calculation is it's quite pleasing visually, matching a peak level from 2014 and suggesting a glass ceiling awaits.
Unfortunately, we're not terribly optimistic, entirely due to the long term threat of parity.
We feel it more likely this relationship shall founder below $1.21, triggering sharp reversal to an initial $1.11 and taking the pair into a zone where our secondary longer-term calculation works out at $1.01 and hopefully ‘bottom’.
Source: Trends and Targets Past performance is not a guide to future performance
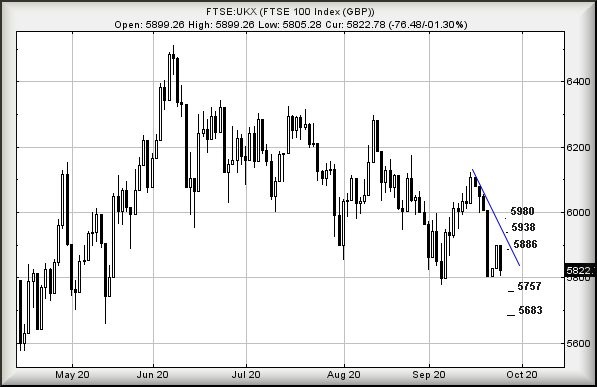
FTSE for Friday (FTSE:UKX)
The market did not complete Thursday in a happy place, making us fear Friday shall produce some continued FTSE 100 misery.
Weakness next below 5,803 points (but don't trust a spike down at the open) suggests reversals coming towards an initial 5,757 points.
If broken, our longer-term (or later that day) secondary calculates at 5,683 points!
If triggered, the tightest stop is relatively sane at 5,867 points. In fact, the risk/reward ratio is such we're starting to wonder if a negative day shall occur.
The converse scenario comes should the FTSE manage to stagger above 5,867 points, as this carries the potential of recovery to a useless 5,886 points.
If exceeded, our secondary works out at 5,938 points, taking the UK market into a region where optimism can easily provide a third target level at 5,980 points.
Source: Trends and Targets Past performance is not a guide to future performance
Alistair Strang has led high-profile and "top secret" software projects since the late 1970s and won the original John Logie Baird Award for inventors and innovators. After the financial crash, he wanted to know "how it worked" with a view to mimicking existing trading formulas and predicting what was coming next. His results speak for themselves as he continually refines the methodology.
Alistair Strang is a freelance contributor and not a direct employee of Interactive Investor. All correspondence is with Alistair Strang, who for these purposes is deemed a third-party supplier. Buying, selling and investing in shares is not without risk. Market and company movement will affect your performance and you may get back less than you invest. Neither Alistair Strang or Interactive Investor will be responsible for any losses that may be incurred as a result of following a trading idea.
These articles are provided for information purposes only. Occasionally, an opinion about whether to buy or sell a specific investment may be provided by third parties. The content is not intended to be a personal recommendation to buy or sell any financial instrument or product, or to adopt any investment strategy as it is not provided based on an assessment of your investing knowledge and experience, your financial situation or your investment objectives. The value of your investments, and the income derived from them, may go down as well as up. You may not get back all the money that you invest. The investments referred to in this article may not be suitable for all investors, and if in doubt, an investor should seek advice from a qualified investment adviser.
Full performance can be found on the company or index summary page on the interactive investor website. Simply click on the company's or index name highlighted in the article.