How the Share Sleuth portfolio has fared 17 years on
Richard Beddard examines long-term and recent performance as the portfolio passes another anniversary. He's also put some cash to work by adding to Hollywood Bowl.
9th October 2026 15:11
by Richard Beddard from interactive investor

Last month was the 17th anniversary of the Share Sleuth portfolio.
Each month, I report Share Sleuth’s performance, but I don’t explain or even think about it. As a long-term investor, I concentrate on decisions that will bring outsized returns in the future from businesses I approve of.
- Invest with ii: Top UK Shares | Share Tips & Ideas | Open a Trading Account
I don’t waste time wondering why my shares are up or down in the short term. I reserve the navel-gazing for this annual review. In the past, I have kept it quite terse, because the portfolio has outperformed over the long term.
“Long term” is vague. To me, it means long enough to profit from businesses that are building on strong capabilities and addressing the risks they encounter.
The strategies businesses follow can pay off over many time frames, but I reckon it should be obvious that a strategy is working after five years. By then success or failure, will be reflected in the share price to some degree.
Not every share will outperform on that timescale, but in aggregate I expect them to. That was the thinking that led me to adopt Share Sleuth’s performance aspiration, which is to beat the equivalent investment in a FTSE All-Share index tracker handsomely over any five-year period.
If the portfolio doesn’t beat the tracker, it’s a warning sign. Perhaps something has gone wrong.
Dishearteningly, for the second year running Share Sleuth has failed to beat its benchmark,FTSE All-Share index tracker (acc), over the last five years. It has performed significantly worse. Over the even longer term, it has done pretty well.
| Share Sleuth performance | |||
| Period to 9 Sep 2026 | Share Sleuth | Index tracker* | SS CAGR |
| 1 year | 16% | 19% | 16% |
| 5 years | 7% | 69% | 1% |
| 10 years | 206% | 118% | 12% |
| 17 years** | 654% | 296% | 13% |
* accumulation units. ** Since inception, 9 September 2009. Past performance is not a guide to future performance. | |||
Last year, I wrote that I thought Share Sleuth’s poor five-year performance was “explained by mistakes...and by the fact that the shares in the portfolio are currently undervalued”.
I still believe this diagnosis, but to elaborate slightly I don’t believe these mistakes happened because I tried less hard. They happened because long-term investing is harder than it was.
The world has changed over the last five years. Perspicacious people will have realised that it started changing in the previous decade, or that it was always changing but the pace of change has increased.
To my mind, the 2010s, the decade in which Share Sleuth handsomely beat the index, was a decade of relative stability. Identifying companies that would do well in future was quite often as easy as identifying companies that had done well in the past and weren’t doing anything stupid to jeopardise their chances of prospering in future.
Geopolitical conflict, extreme weather, the disruptive potential of both AI and the vast amounts of money being invested in it, are having palpable effects on businesses. Maxed-out state finances are limiting governments’ ability to help.
Investors have relearned forgotten vocabularies describing disrupted supply chains and inflationary costs. We’re grappling with a new technology that resembles magic.
- Case study: managing a £1.25m pension and ISA portfolio in midlife
- The Income Investor: why I like this FTSE 100 share’s 6% dividend yield
I made changes early last year to the way I analyse shares to better understand these risks and give them more weight in my scores. It is a drag, I know, but as with any long-term strategy it will be years before I can be confident that the impact of these changes has been positive.
I feel more confident this year though. The resulting scores are lower in aggregate, and I feel more realistic. Lower scores mean smaller holding sizes (see the explainer linked below for how this works), which in turn means a more diversified portfolio.
My focus for the coming year is to learn enough about some new candidates to score them. If their scores are good enough, I will substitute them for weaker holdings.
I’m not predicting a return to five-year outperformance next year. The portfolio would require a knock-out year to achieve that. But for technical reasons the five-year comparison may get easier.
Five years ago, on 9 September 2021, Share Sleuth was worth £212,000. That was a month after the portfolio reached a peak valuation it only returned to earlier this year.
A sharp decline followed that peak, and on 9 September 2022, it was worth £165,000. Next year’s five-year base line is more forgiving.
Trade
On 30 September, my trading day this month, Share Sleuth held £5,809 in virtual cash, less than £100 more than its minimum trade size (2.5% of its total value).
The highest-quality candidates for investment were:
| company | score | qual | price | ih% | ss% | ih%-% | last trade | annual report date | |
| 1 | FW Thorpe | 9.9 | 9.0 | 0.9 | 9.8% | 7.1% | 2.7% | 04/11/25 | 15/10/25 |
| 2 | Hollywood Bowl | 8.6 | 8.0 | 0.6 | 7.3% | 4.4% | 2.9% | 26/02/26 | 05/01/26 |
| 8 | Cake Box | 7.8 | 7.0 | 0.8 | 5.5% | 2.5% | 3.1% | 26/08/26 | 05/08/26 |
| 9 | Anpario | 7.7 | 7.0 | 0.7 | 5.3% | 2.4% | 2.9% | 12/08/21 | 01/06/26 |
Click on a share's score to see a breakdown (scores may have changed due to movements in share price). Key: qual is the share’s score out of 9 for the three quality factors (capabilities, risks, and strategy), price is the price score from -3 to +1, ih% is the suggested ideal holding size as a percentage of the total value of a diversified portfolio, ss% is the actual size of Share Sleuth’s holding, and ih%-% is the difference between ideal and actual sizes. Annual report dates may not have been confirmed by the company.
The Decision Engine was also nudging me to reduce Share Sleuth’s holding in Oxford Instruments (LSE:OXIG):
| company | score | qual | price | ih% | last trade | annual report date | |
| 20 | Oxford Instruments | 6.9 | 7.0 | -0.1 | 3.8% | 28/07/25 | 23/06/26 |
For notes, see previous table.
Thorpe (F W) (LSE:TFW)’s annual report was imminent. It was also likely that Hollywood Bowl Group (LSE:BOWL) would publish a full-year trading statement in October. Oxford Instruments usually publishes a half-year trading update at this time of year.
Being a long-term investor, I don’t often worry in advance of trading statements because I expect the shares I have chosen to ride out bumps in the road. However, the annual report triggers a re-scoring, so FW Thorpe was out of contention.
Cake Box Holdings Ordinary Shares (LSE:CBOX) was a new addition to the portfolio in August, and I would like to get to know it better before committing more funds to it.
- Stockwatch: time to buy the drop at this market leader
- Sign up to our free newsletter for investment ideas, latest news and award-winning analysis
Although we have had a hot dry summer, and probably fewer people went tenpin bowling than usual, I decided to add more shares in Hollywood Bowl in the expectation that it will continue rolling out profitable bowling centres in the UK and Canada.
I slept on the decision. Then, on Thursday 1 October, I added 2,301 shares to the portfolio’s holding in Hollywood Bowl.
The actual price, quoted by a broker, was 248p. The total cost was £5,754 after deducting £10 in lieu of fees and £29 in lieu of stamp duty.
As a postscript, Hollywood Bowl yesterday (6 October) published a trading statement. It confirmed that it expects a modest rise in revenue and profit in line with analysts expectations for the year to December 2026. Like-for-like sales in the UK fell marginally due to the hot weather.
Share Sleuth performance
At the close on Monday 5 October, Share Sleuth was worth £229,287, 664% more than the £30,000 of pretend money we started with in September 2009.
The same amount invested in accumulation units of a FTSE All-Share index tracking fund would be worth £116,617, an increase of 289%.
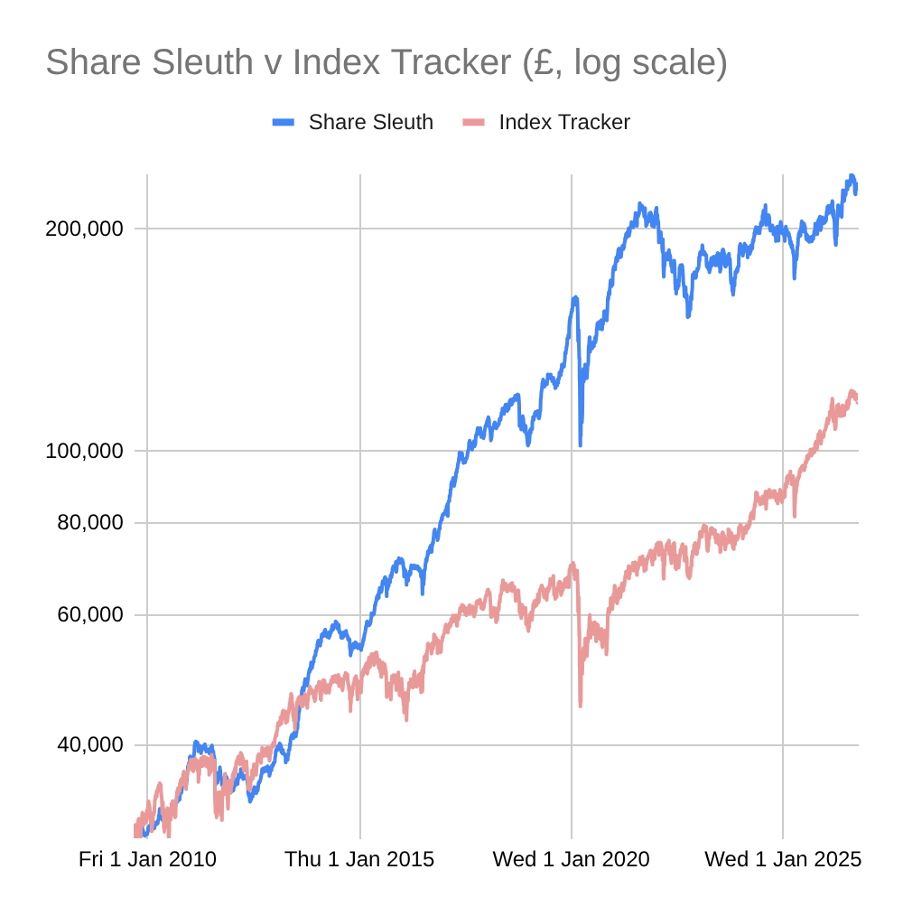
Past performance is not a guide to future performance.
After dividends paid during the month from 4imprint Group (LSE:FOUR), Cohort (LSE:CHRT), Games Workshop Group (LSE:GAW), Quartix Technologies (LSE:QTX) and Solid State (LSE:SOLI), Share Sleuth’s cash pile is a paltry £248.
The minimum trade size, 2.5% of the portfolio’s value, is £5,732.
| Share Sleuth, 05 Oct 2026 | Cost (£) | Value (£) | Return (%) | ||
| Cash (0% of portfolio) | 248 | ||||
| Current holdings (27 shares) | 229,039 | ||||
| Total, and performance since 9 September 2009 | 30,000 | 229,287 | 664 | ||
| Benchmark: FTSE All-Share index tracker (acc) | 30,000 | 116,717 | 289 | ||
| Companies | Shares | Cost (£) | Value (£) | Return (%) | |
| AMS | Advanced Medical Solutions | 1,965 | 4,503 | 5,541 | 23 |
| ANP | Anpario | 1,124 | 4,057 | 5,732 | 41 |
| BMY | Bloomsbury | 1,007 | 5,002 | 6,435 | 29 |
| BNZL | Bunzl | 417 | 9,798 | 10,934 | 12 |
| BOWL | Hollywood Bowl | 6,303 | 16,102 | 15,600 | -3 |
| CBOX | Cake Box | 3,041 | 5,879 | 5,322 | -9 |
| CHH | Churchill China | 1,495 | 17,228 | 5,307 | -69 |
| CHRT | Cohort | 836 | 6,315 | 10,199 | 62 |
| FAN | Volution | 830 | 5,151 | 5,370 | 4 |
| FOUR | 4Imprint | 116 | 2,251 | 4,972 | 121 |
| GAW | Games Workshop | 66 | 4,116 | 11,200 | 172 |
| GDWN | Goodwin | 36 | 871 | 5,004 | 475 |
| HWDN | Howden Joinery | 1,476 | 10,371 | 11,114 | 7 |
| JET2 | Jet2 | 822 | 5,211 | 11,672 | 124 |
| KEYS | Keystone Law | 1,024 | 5,550 | 7,066 | 27 |
| LTHM | James Latham | 1,150 | 14,437 | 12,535 | -13 |
| MACF | Macfarlane | 7,689 | 10,011 | 6,459 | -35 |
| OXIG | Oxford Instruments | 505 | 10,044 | 15,392 | 53 |
| PRV | Porvair | 906 | 4,999 | 7,973 | 59 |
| QTX | Quartix | 1,618 | 3,988 | 3,754 | -6 |
| RNWH | Renew Holdings | 1,310 | 9,804 | 12,746 | 30 |
| RSW | Renishaw | 117 | 3,698 | 6,850 | 85 |
| SCT | Softcat | 382 | 5,508 | 7,010 | 27 |
| SOLI | Solid State | 5,009 | 6,033 | 8,315 | 38 |
| TFW | Thorpe (F W) | 6,153 | 14,861 | 15,998 | 8 |
| TSTL | Tristel | 1,432 | 5,509 | 5,943 | 8 |
| TUNE | Focusrite | 2,020 | 14,128 | 4,596 | -67 |
Notes:
Costs include £10 broker fee, and 0.5% stamp duty where appropriate
Cash earns no interest
Dividends and sale proceeds are credited to the cash balance
Objective: To beat the index tracking fund handsomely over five-year periods
Source: ShareScope.
Richard Beddard is a freelance contributor and not a direct employee of interactive investor.
Richard owns all the shares in the Share Sleuth portfolio.
For more on the Decision Engine and Share Sleuth, please see Richard’s explainer.
Contact Richard Beddard by email: richard@beddard.net or on Twitter: @RichardBeddard
These articles are provided for information purposes only. Occasionally, an opinion about whether to buy or sell a specific investment may be provided by third parties. The content is not intended to be a personal recommendation to buy or sell any financial instrument or product, or to adopt any investment strategy as it is not provided based on an assessment of your investing knowledge and experience, your financial situation or your investment objectives. The value of your investments, and the income derived from them, may go down as well as up. You may not get back all the money that you invest. The investments referred to in this article may not be suitable for all investors, and if in doubt, an investor should seek advice from a qualified investment adviser.
Full performance can be found on the company or index summary page on the interactive investor website. Simply click on the company's or index name highlighted in the article.
Disclosure
We use a combination of fundamental and technical analysis in forming our view as to the valuation and prospects of an investment. Where relevant we have set out those particular matters we think are important in the above article, but further detail can be found here.
Please note that our article on this investment should not be considered to be a regular publication.
Details of all recommendations issued by ii during the previous 12-month period can be found here.
ii adheres to a strict code of conduct. Contributors may hold shares or have other interests in companies included in these portfolios, which could create a conflict of interests. Contributors intending to write about any financial instruments in which they have an interest are required to disclose such interest to ii and in the article itself. ii will at all times consider whether such interest impairs the objectivity of the recommendation.
In addition, individuals involved in the production of investment articles are subject to a personal account dealing restriction, which prevents them from placing a transaction in the specified instrument(s) for a period before and for five working days after such publication. This is to avoid personal interests conflicting with the interests of the recipients of those investment articles.