RBS: The essential levels to look out for
With RBS shares still under pressure, our chartist calculates where a rebound might kick in.
5th August 2019 09:20
by Alistair Strang from Trends and Targets
With RBS shares still under pressure, our chartist calculates where a rebound might kick in.
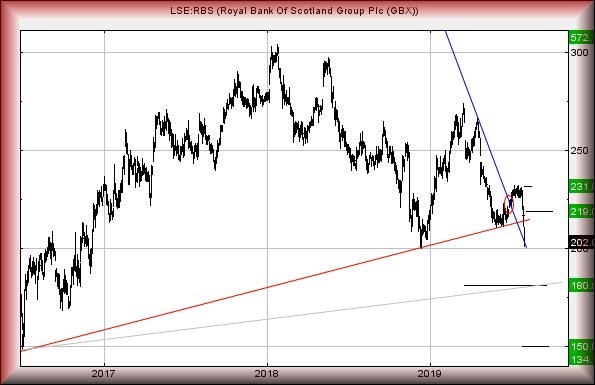
In our previous report on RBS (LSE:RBS) we strongly suspected the price would reverse to 202p.
It did, closing Friday at 202.9p! That's 20p in old money (pre share split) for those who harbour a grudge.
The share price is now pretty much at the level of 2009, when the stock market bottomed.
Unfortunately for RBS, the share price has been playing chicken with the two quid level for a few years but has become dangerous.
There is a slight phenomena which gives some near-term hope. The blue downtrend on the chart dates back to September 2008.
Today, this line is at 200.047p and represents the level RBS share price needs to actually close below to justify hysterics.
Such a triggering event will make weakness down to an initial 180p calculate as an initial point at which we'd hope for a rebound. If (when) broken, the price should eventually bottom at 150p.
Unfortunately, in the perpetual limbo dance which is RBS, we can calculate lower than 150p...
To be realistic, should it ever visit the 130's, it would become a very tempting long position to take, just to see what will happen.
For now though, some slight hope for a near-term bounce is slightly possible, due to the respect paid to the long-term blue downtrend from 2008.
If we look for immediate clues as to whether any bounce has integrity, above 207.4p calculates with an initial ambition at 211.25p.
If exceeded, secondary is a bit more useful and works out at 219p.
This should rebound the price to a useful level, just above the red uptrend and hint "bottom is in", thus giving the potential of an unusual third target level at 231p, along with some almost certain hesitation.
We suspect it intends to hit 150p eventually, once sufficient excuses for reversal are accumulate.
Source: Trends and Targets Past performance is not a guide to future performance
Alistair Strang has led high-profile and "top secret" software projects since the late 1970s and won the original John Logie Baird Award for inventors and innovators. After the financial crash, he wanted to know "how it worked" with a view to mimicking existing trading formulas and predicting what was coming next. His results speak for themselves as he continually refines the methodology.
Alistair Strang is a freelance contributor and not a direct employee of Interactive Investor. All correspondence is with Alistair Strang, who for these purposes is deemed a third-party supplier. Buying, selling and investing in shares is not without risk. Market and company movement will affect your performance and you may get back less than you invest. Neither Alistair Strang, or interactive investor will be responsible for any losses that may be incurred as a result of following a trading idea.
Alistair Strang has led high-profile and "top secret" software projects since the late 1970s and won the original John Logie Baird Award for inventors and innovators. After the financial crash, he wanted to know "how it worked" with a view to mimicking existing trading formulas and predicting what was coming next. His results speak for themselves as he continually refines the methodology.
Alistair Strang is a freelance contributor and not a direct employee of Interactive Investor. All correspondence is with Alistair Strang, who for these purposes is deemed a third-party supplier. Buying, selling and investing in shares is not without risk. Market and company movement will affect your performance and you may get back less than you invest. Neither Alistair Strang or Interactive Investor will be responsible for any losses that may be incurred as a result of following a trading idea.
These articles are provided for information purposes only. Occasionally, an opinion about whether to buy or sell a specific investment may be provided by third parties. The content is not intended to be a personal recommendation to buy or sell any financial instrument or product, or to adopt any investment strategy as it is not provided based on an assessment of your investing knowledge and experience, your financial situation or your investment objectives. The value of your investments, and the income derived from them, may go down as well as up. You may not get back all the money that you invest. The investments referred to in this article may not be suitable for all investors, and if in doubt, an investor should seek advice from a qualified investment adviser.
Full performance can be found on the company or index summary page on the interactive investor website. Simply click on the company's or index name highlighted in the article.