FTSE for Friday: can FTSE 100 finally stage a breakout?
Unable to make a break above 7,700 stick since last spring, the UK's blue-chip index is frustrating investors. Independent analyst Alistair Strang studies the charts for signs of sustainable upside.
8th March 2024 07:36
by Alistair Strang from Trends and Targets
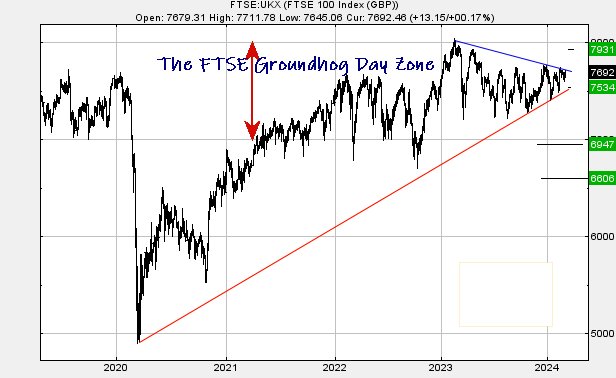
The eternal Groundhog Day in which the UK stock market is trapped continues to frustrate everyone. Across the pond, US markets are taking turns in painting new all-time highs whereas here, the only thing worth painting appears to be frustrated lines on charts.
The current hiatus isn’t fascinating, just a bit weird, as the UK now appears to be battling with the pre-pandemic high of 2020. Quite why this should be the case defeats us but, once again, with the market closing Thursday at 7,692 points, we’re in the sacred zone below 7,700 points where nothing ever happens.
- Invest with ii: Open a Stocks & Shares ISA | ISA Investment Ideas | Transfer a Stocks & Shares ISA
We’ve a saying in-house; “If it ain’t going up, it’s going down!” but the FTSE 100 isn’t even showing any early warning signs for imminent trouble. It’s just not going up, almost aggressively so, as if some mysterious foot keeps tramping on the brake pedal.
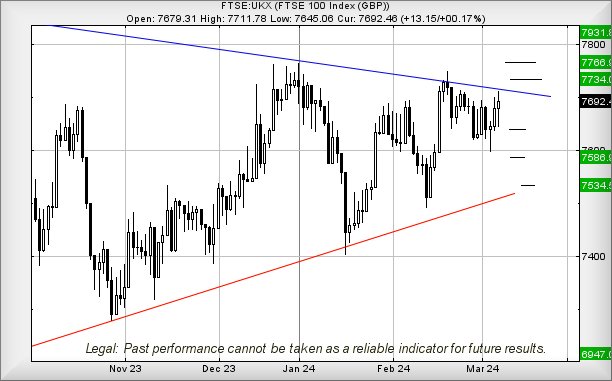
The immediate situation for the FTSE allegedly suggests above 7,712 points should bring movement to an initial 7,734 with our secondary, if bettered, at 7,766 points. We tossed in the word “allegedly as there’s nothing in recent market movement which justified any real confidence. Who knows, maybe the markets are not moving due to a self-fulfilling lack of confidence! If triggered, the tightest stop for this scenario looks like a fairly reasonable 7,670 points.
Our alternate scenario, if the brakes are once again applied, allows below 7,670 to threaten a visit to 7,638 with our “longer term” secondary calculating at 7,588 points.
Have a good weekend.
Source: Trends and Targets. Past performance is not a guide to future performance.
Source: Trends and Targets. Past performance is not a guide to future performance.
Alistair Strang has led high-profile and "top secret" software projects since the late 1970s and won the original John Logie Baird Award for inventors and innovators. After the financial crash, he wanted to know "how it worked" with a view to mimicking existing trading formulas and predicting what was coming next. His results speak for themselves as he continually refines the methodology.
Alistair Strang is a freelance contributor and not a direct employee of Interactive Investor. All correspondence is with Alistair Strang, who for these purposes is deemed a third-party supplier. Buying, selling and investing in shares is not without risk. Market and company movement will affect your performance and you may get back less than you invest. Neither Alistair Strang or Interactive Investor will be responsible for any losses that may be incurred as a result of following a trading idea.
These articles are provided for information purposes only. Occasionally, an opinion about whether to buy or sell a specific investment may be provided by third parties. The content is not intended to be a personal recommendation to buy or sell any financial instrument or product, or to adopt any investment strategy as it is not provided based on an assessment of your investing knowledge and experience, your financial situation or your investment objectives. The value of your investments, and the income derived from them, may go down as well as up. You may not get back all the money that you invest. The investments referred to in this article may not be suitable for all investors, and if in doubt, an investor should seek advice from a qualified investment adviser.
Full performance can be found on the company or index summary page on the interactive investor website. Simply click on the company's or index name highlighted in the article.