Stockwatch: Tasty turnaround or chronic indigestion?
20th July 2018 10:57
by Edmond Jackson from interactive investor
This stock looks cheap on paper and there are indications the company has turned a corner, but plenty of risks remain. Here's what Edmond Jackson thinks of prospects.
Does a modest chart break-out, pressure from activist investors and a firm trading update, hint finally at turnaround for one of Britain's main processed foods producers?
Premier Foods is capitalised at near £400 million in the FTSE SmallCap index, though it had £496 million net debt last March (if down from £523 million a year before) and a £437 million pension deficit (down from £489 million). That's in a balance sheet context also of £1,074 million goodwill/intangibles, hence negative net tangible assets per share of 15p. As I will explain, I would also not especially fancy being a trade creditor here.
A perennial recovery stock
Plenty of recovery investors have been attracted to Premier Foods: years ago, investment bank Warburg Pincus had a 13.75% stake but appeared to cut its losses; then, in 2016, US spice maker McCormick made a series of takeover offers up to 65p a share, rebuffed with the help of Japan's Nissin Foods buying a 17.3% stake. The head of equities at Standard Life said at the time a 60p offer range was "too low", but "we remain open to a bid at a higher level."
All such investors had presumably looked at Premier's circa £800 million revenue on a respectable 10% margin and assumed, with further honing, the group's intrinsic value could be worth plenty more.
Yet the stock has bumped along in a 36p to 48p channel and, though last year's financial results were quite respectable for a supermarket supplier – adjusted pre-tax profit up 5.9% to £78.6 million, on revenue up 3.6% to £819 million – it's proving a long haul to cut debt from a past acquisitions spree.
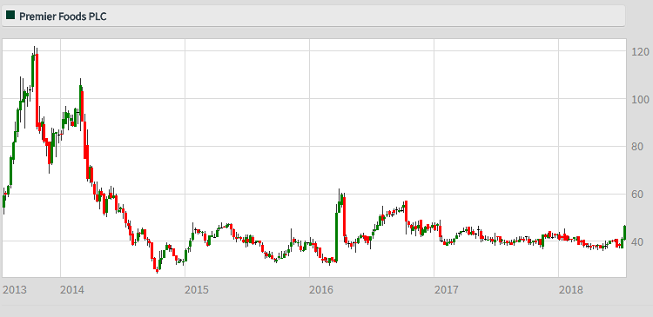
Source: interactive investor Past performance is not a guide to future performance
Sandwiched between liabilities and processed foods
At about 45p, the stock has since June risen from the low end of its two-year range amid an effort by several large investors to remove Joe Darby, Premier's chief executive of five years. This was marginally defeated at last Wednesday's AGM, although the stock remains firm.
While I'd concur, aspects of his stewardship are in question and it is tempting to seize on CEO change as a remedy and "activists" as a buy signal. Yet the real problem is Premier being restrained to invest to modernise its range of largely processed food – what we are nowadays told to eat far less of – given a persisting need to tackle its debt and pensions deficit.
Fray Bentos tinned meat pies were sold off in 2011, though the product emphasis remains e.g. Angel Delight, Atora shredded suet, Batchelors dehydrated foods and condensed soups, Bisto gravy, Cadbury's cakes and chocolate spread.
In fairness, Batchelors pot noodles and even dear ol' Angel Delight are doing well currently, though organic growth from food ideally needs "something new" like the way AIM-listed Finsbury Food Group carved out a bakery niche in specialty/gluten-free, cakes and breads - to become a £150 million business.
Supermarkets and take-away's are expanding supply in ready-made vegan meals and dairy-free items hence, if such a specialist supplier floated, then its shares would likely command a growth premium. Larger food groups must adapt as tastes change, but Premier is quite hamstrung.
Net finance costs sap 64% of operating profit
Beyond quite attractive 2017/18 results highlights, the income statement shows £75.8 million operating profit pre-£6.5 million amortisation costs, then a big whack of £48.4 million net finance costs versus £49.5 million in the 2016/17 year. Short-term debt has been eliminated, albeit with a commensurate rise in long-term borrowings: £535 million senior secured notes listed on the Irish GEM Stock Exchange, note 7 to the accounts clarifies as "split between fixed and floating tranches."
A fixed £325 million note matures in March 2021 with a 6.5% interest rate, while £210 million matures in July 2022 with a rate of 5.0% above LIBOR. Thus, Premier is exposed potentially to rate rises offsetting its ability to cut debt, although the Bank of England's wariness about Brexit harming the UK economy will probably cap much of a rise.
Pension liabilities are complex, given schemes both for Premier and RHM (Rank Hovis McDougall which Premier acquired in 2007) where note 9 cites Premier's schemes with "significant technical funding deficits which could increase", while "the RHM scheme is currently in surplus, but subsequent valuations could reveal a deficit." The group may muddle along, but some investors would regard such liabilities, combined with the debt burden, as off-limits lest a worse-case scenario evolves.
I should also note, at end-March the current ratio of near-term assets/liabilities was 0.78, and the quick ratio (i.e. subtracting inventory) only 0.44, i.e. Premier cannot meet its current liabilities, although the situation did improve over the year mainly due to a rise in period-end cash. It results from trade payables nearly three times trade receivables, begging the question whether Premier is effectively taking credit from suppliers.
Yet the CEO emphasises growth drivers
At May's prelims, the CEO presented 3.6% revenue growth as the strongest for over five years, rising 7% in Q4 after a slow Q1: "three important drivers being international business up 25% and almost double the level three years ago, while the benefits from our Nissin and Mondalez International partnerships contributed 55% of revenue growth."
With due respect, he has capitalised on the current noodles fashion: "Batchelors is now the fastest growing brand in our portfolio having being turned around from decline three years ago to double-digit growth for the past year...new products designed to meet consumer trends such as Super Noodles, sold over 13 million pots."
An 18 July update for the current year's Q1 shows sales up 1.7% like-for-like, albeit a mixed performance in terms of branded versus non-branded, grocery and sweet treats. Mr Kipling has benefited from a re-launch in March backed by TV advertising, re-design and new packaging, though in terms of value you can't see what the cost of its 14% UK sales increase was.
The end-March annual cash flow statement shows chiefly £15.8 million spent on property/plant/equipment versus net cash from operations up 42% to £52.4 million, meanwhile, the income statement implied marketing costs as a percentage of turnover reduced from 16.1% to 14.1% year-on-year. So, in key respects, Darby is wresting a turnaround if cherry-picking some best bits for his narrative.
Cheap PE but no dividend
With shareholder payouts unrealistic for some years yet, and a still risky balance sheet, the stock trades on sub-6 times projected earnings rather than the 16 times you could expect if the market was genuinely confident and finances were in better shape.
Overall, it does look like Premier has turned a corner, though in light of Finsbury warning on 16 July about "unprecedented commodity and labour inflation", Premier may need to go further than consolidate warehousing and distribution, to contain costs.
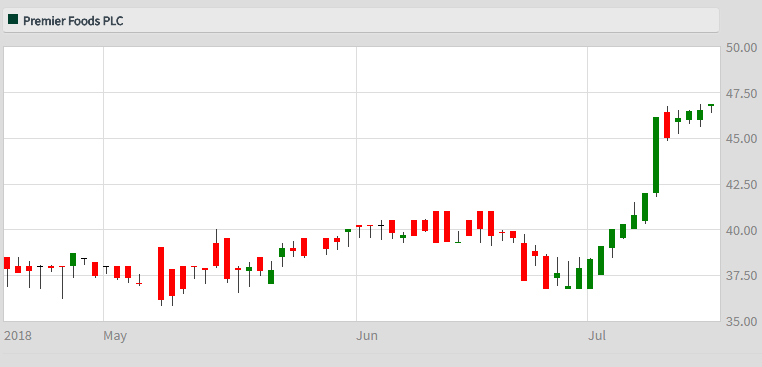
Source: interactive investor Past performance is not a guide to future performance
Existing shareholders should take some heart, but with fresh money I’d await more evidence, especially regarding this new risk as to costs.
"Everyone has to eat" does not make food groups impervious to a difficult UK outlook. Premier's balance sheet risks may be containable but, given the first rule of investing is capital protection, my stance tips to: Avoid.
| Premier Foods - financial summary | |||||||
|---|---|---|---|---|---|---|---|
| year ended 31 Mar | |||||||
| 2013 | 2015 | 2016 | 2017 | 2018 | 2019 | 2020 | |
| 15 months | 13 months | ||||||
| Turnover (£ million) | 843 | 767 | 772 | 790 | 819 | ||
| IFRS3 pre-tax profit (£m) | 4.4 | -108 | -13.0 | 12.0 | 20.9 | ||
| Normalised pre-tax profit (£m) | 23.2 | -22.4 | 15.5 | 32.6 | 41.5 | 28.4 | 41.2 |
| Operating margin (%) | 4.9 | 3.6 | 10.0 | 9.8 | 9.8 | ||
| IFRS3 earnings/share (p) | -12.8 | -10.1 | 4.1 | 0.7 | 0.7 | ||
| Normalised earnings/share (p) | -7.7 | 1.6 | 7.6 | 3.2 | 0.9 | 7.6 | 8.2 |
| Earnings per share growth (%) | 387 | -58.3 | -72.8 | 783 | 8.7 | ||
| Price/earnings multiple (x) | 54.4 | 5.9 | 5.5 | ||||
| Historic annual average P/E (x) | 25.4 | 11.9 | 10.5 | 33.6 | |||
| Cash flow/share (p) | 23.9 | 0.4 | 11.5 | 4.5 | 6.2 | ||
| Capex/share (p) | 7.0 | 4.4 | 3.6 | 2.5 | 2.3 | ||
| Net tangible assets per share (p) | -347 | -76.8 | -35.5 | -38.6 | -14.9 | ||
| Source: Company REFS | |||||||
Edmond Jackson is a freelance contributor and not a direct employee of interactive investor.
These articles are provided for information purposes only. Occasionally, an opinion about whether to buy or sell a specific investment may be provided by third parties. The content is not intended to be a personal recommendation to buy or sell any financial instrument or product, or to adopt any investment strategy as it is not provided based on an assessment of your investing knowledge and experience, your financial situation or your investment objectives. The value of your investments, and the income derived from them, may go down as well as up. You may not get back all the money that you invest. The investments referred to in this article may not be suitable for all investors, and if in doubt, an investor should seek advice from a qualified investment adviser.
Full performance can be found on the company or index summary page on the interactive investor website. Simply click on the company's or index name highlighted in the article.