Three high-yield trusts profiting from property
16th November 2018 13:54
This content is provided by Kepler Trust Intelligence, an investment trust focused website for private and professional investors. Kepler Trust Intelligence is a third-party supplier and not part of interactive investor. It is provided for information only and does not constitute a personal recommendation.
Material produced by Kepler Trust Intelligence should be considered a marketing communication, and is not independent research.
How the commercial property sector is coping with widespread disruption caused by the rise of the internet.

Future shock
Thomas McMahon, senior analyst at Kepler Trust Intelligence.
The effects of technological change on the equity market have been much written about and discussed, and the structure of stockmarkets profoundly changed over the past decade. The UK commercial property market is seeing equally significant changes which have gone under the radar somewhat, we suspect largely due to concerns about the consequences of Brexit.
Whatever those are, they will be temporary and largely cyclical, but the changes effected by technology, chiefly the internet, will be long-lasting and secular and have a much more profound impact on the contents and structure of investment portfolios.
The main issue is the rise of online shopping and its consequences for retail property and distribution warehouses. Another issue is the change in how companies use offices: the growth in co-working, the rise in remote working, and more flexible ways of using property, all of which tends to trend towards a reduction in the footprint needed by commercial property users.
We review how the mainstream UK property trusts are positioned vis-à-vis these trends and explore how this new reality can be exploited by investors.
The death of retail?
The UK high street has seen numerous failures in 2018. Poundworld and Maplin have gone bust, while Mothercare, House of Fraser and New Look are among those agreeing CVAs with creditors and Carphone Warehouse among those cutting back on the number of stores they run.
While there are stock specific issues in each case, the chief reason for so many failures in the retail sector is the growth in internet shopping which is keeping consumers out of shops and seeking cheap deals and easier transactions online.
Such is the devastation that it has become a live political debate, with the cut to business rates for smaller retailers in the budget a limited response by the government.
The falls in sterling and in consumer confidence since the 2016 referendum have been blamed for the difficulties of some incumbents, and no doubt have had some effect. However, retail sales are up 6% since the Brexit vote, according to ONS statistics, and online sales have grown from 13.9% of the total to 17.1% over the same time period.
We therefore believe the far more significant effect on the high street is the growth of online shopping.
This threat has led to swathes of retail property coming onto the market, and there is no sign of this trend slowing.
According to the latest Royal Institute of Chartered Surveyors (RICS) survey, Q3 was the sixth consecutive quarter of falling demand for retail property, with a net +39% of respondents reporting a rise in retail availability and a net -33% reporting a fall in enquiries about retail space.
On the supply side, this was the fifth consecutive quarter of increasing stock being available, while surveyors report a rise in the incentives landlords are having to offer to attract tenants. Respondents expect rental growth and capital values to be firmly negative in the retail sector over the next 12 months. There has been a clear divergence in the trend for retail against that for offices and industrials since 2016, indicating that a factor not common to the whole economy is in play; technological change.

Data from community shopping centre investor Ellandi shows this trend is likely to be here for the long-term.
According to the latest Ellandi Shopper Survey, 60% of millennials buy online at least every month compared to just 20% of baby boomers. Those who shop online regularly tend to spend less time in bricks and mortar shops when they use them but also visit them less frequently, meaning that impulse buys and upselling are less and less likely to support high street retail.
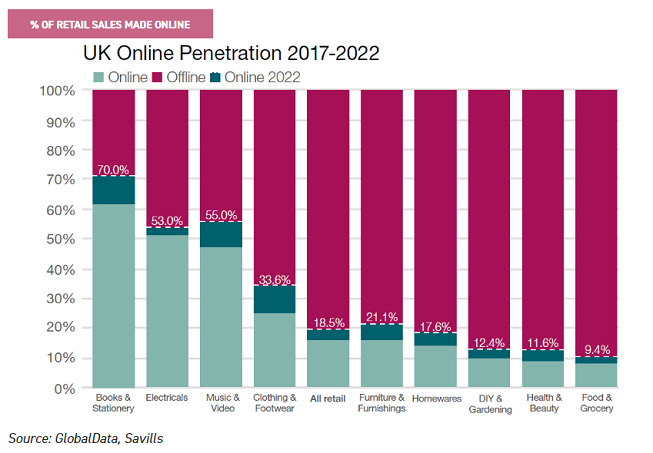
According to GlobalData (chart below), online sales should make up 18.5% of retail sales in the UK in 2022. Certain sectors are more affected than others. Just over 60% of books and stationary sales are made online, forecast to rise to 70% in 2022, while half of electricals are sold online, to rise to 53%. Food and grocery sales are largely physical affairs, however, and only 9.4% are forecast to be made online by 2022.
The challenge to office space
The office sector is also undergoing structural changes. Fund managers report that the growing trend for remote working and desk sharing is a major factor behind companies requiring less office space than in the past – these trends are a consequence of the ease in communication at a distance and data transfer allowed by the internet.
Jason Baggaley, manager of the Standard Life Property Income Trust, estimates that changes in working patterns mean that companies require around 75% of the space per person that they would have done a decade ago.
Flexible working groups such as WeWork offer companies the ability to rent more modern spaces at much shorter lease lengths with all the modern features that allow desk sharing, flexible hours etc.
WeWork has rented more space in London's central office districts since 2012 than any other company, according to US estate agent Cushman & Wakefield, and nearly double the take up of Google.
In the City, its footprint doubled in 2017. In regional UK cities, the take-up of space by flexible office groups such as WeWork jumped to 7.5% of all activity in 2017, up from 2% in 2016.
- How to generate high dividend income from rising supermarket property yields
- 10 top investment trusts for your retirement portfolio
- These 'hidden gem' investment trusts could be long-term core holdings
One consequence of this is an acceleration in the trend for offices to take up less space per worker – WeWork estimate that companies which use them are 2.5x more "efficient" in their use of space. This is one factor behind the precipitous fall in office space per worker in the US, where this trend is more advanced: according to data from Cushman & Wakefield, office space per worker has fallen by 8.3% since 2009. The features of the typical flexible office group property are requirements for any company now seeking "grade A" office space.
Grade A space is the most modern and sophisticated class of office property, with flexible working provision and efficient layouts key features of contemporary offerings. Within the office space, the market as a whole is seeing a shortage of Grade A supply, according to data from Savills, with available space down by 1 million square feet year on year in September.
There is therefore a fall in the supply of the type of property that is most desirable and in keeping with modern working practices.
This is creating an environment in which sector yields are remaining static rather than falling despite the substantial uncertainty around the UK economy and the falling demand in square foot per worker. Managers are repositioning themselves cautiously within the sector.
The state of the sector
We looked at the multi-sector UK commercial property trusts, excluding those with highly specialised remits, esoteric focuses or a focus on a sector other than commercial.
The last date for which we have consistent data is June 2018, the end of Q2, which is recent enough given we do not expect dramatic changes to sector allocation quarter on quarter.
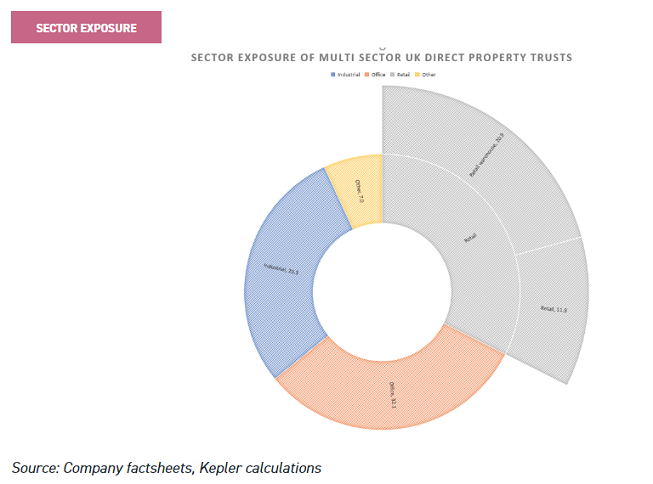
The most striking result was that the retail sector was the highest exposure of the funds at 32.8%. There is a 32.1% average allocation to Office and a 29.3% to Industrial.
It is interesting how much of the sector is still invested in retail assets despite almost every manager we speak to being negative on the sector as a whole.
One reason is that managers are still shifting their portfolios to account for the new reality. It can take considerable time and cost to arrange the sale of a property, and we believe that the pace of change in the retail space has surprised many managers as it has many politicians, analysts and commentators.
However, a second, perhaps more interesting, reason is in the sub-sector makeup of this retail exposure. By our calculations, 20.9% of the sector is invested in "retail warehouses" and just 7.8% in other retail - high streets and shopping centres.
Retail warehouses are out of town shopping centres and retail parks which fit more easily with the new shopping habits of consumers. They allow retailers to serve click and collect customers more easily which is increasingly important to lure them into physical stores and which leads to further sales. Millennials are twice as likely as baby boomers to use click and collect, according to Ellandi's survey, which also finds click and collect customers spend more on average per visit to a bricks and mortar store.
Retail warehouses can also be used as bases for last mile delivery services, as well as being cheaper to run and easier to develop, a benefit to businesses whose margins are being eaten away by Amazon. Many managers are finding opportunities in this sub-sector, most notably Ediston Property Investment Company, which is 74% invested in retail warehouses.
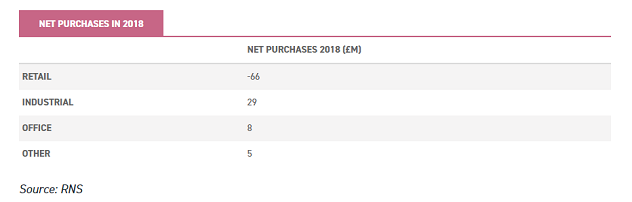
However, the general trend in sector exposure is clear. We analysed all purchases and sales made by the trusts in our sample in 2018 by sector to calculate the net purchases made.
The industrial sector was by far the most bought with £29 million in net purchases. This sector is seen as the most resilient to the changes in shopping patterns and a potential beneficiary through being used for storage, logistics and distribution.
Retail, by contrast, saw net sales of £66 million and offices modest net purchases of £9 million.
Conclusion
We are unsure how far the trend to industrial will continue. Jason Baggaley, who has over half his portfolio in industrials, says that the competition for assets in this sector means that they are increasingly looking expensive and stock selection is becoming ever more important.
According to Savills, in September yields in prime industrial properties were averaging 4% to 4.25%, having tightened by 50 basis points (bps) over a year. Only West End and City prime yields were lower.

By comparison, retail warehouses have moved from 5.5% to 5.75% having risen by 25bps over 12 months. Yields on the other retail sub-sectors rose 50bps over the period.
Yields on non-prime locations can be considerably higher, of course. Anecdotally, we hear that some major institutional investors are selling properties in the industrial sector too, taking profits on a sector that has traditionally been valued on higher yields than the other property sectors.
Markets tend to overreact, and it may be that yields will slip enough in retail to draw managers back in, albeit perhaps more selectively than in the past.
However, Michael Morris, chief executive of Picton Property Income, warns the retail property market may not have yet fully accepted the new reality as the negative rental growth we have seen in the sector has been very limited so far, yet there is a wave of property coming onto the market from failing businesses or business models that is likely to depress rents further.
He also notes that one of the ways retailers have responded to the pressure of the internet has been to combine property footprints.
For example, Argos now takes up space inside Sainsbury's stores on many sites, so the combined two retailers need a much more limited footprint. Other retailers may follow a similar strategy in future.
Therefore, we may have to wait some time for the bottom to be found. We would note though, that the rate of growth of internet shopping as a percentage of total sales is slowing, which may be a light at the end of the tunnel.
It is also worth noting that disruption in the economy is happening at a faster rate than ever thanks to the speeding up of the development of new technologies which could directly affect the property sector.
One technology potentially on the horizon is using drones for last mile deliveries –could this affect the attractiveness of retail warehouses by reducing the need for click and collect services?
Could it even reduce demand for industrial property? If drones rather than vans are increasingly used then the location of sites required by distributors could change, and the shape of logistics hubs may change. Industrial sites which seem in prime position to service the emerging trends might become less attractive at their higher prices.
We have included a table showing where the current multi-sector trusts stand below. Ediston has the highest allocation to retail in the peer group for the reasons described below – all this exposure is retail warehousing.
Drum Income Plus REIT also has high exposure here; the trust focuses on smaller lot sizes in regional locations. AEW UK REIT and F&C Commercial Property have the highest exposure to non-warehouse retail. Notably, UK Commercial Property has reduced its retail exposure from c45% in 2015 to just 31% after a revamp of strategy under new manager Will Fulton.
Standard Life Property Income has the highest exposure to industrials followed by AEW and Picton.

Trusts have responded to the challenge of the internet economy in different ways. As we have highlighted, Ediston Property Investment Company REIT focuses almost exclusively on the retail warehouse sector. The managers believe that valuations are frequently attractive in this area thanks to the general aversion to retail as a whole.
They specialise in using asset management initiatives to add value to their assets, and have this year done their first forward financed deal. The trust is trading on a 7.7% discount and has a dividend yield of 5.4%. We have initiated coverage of the trust in a note published this week.
Standard Life UK Property Income is tilted to the industrial sector, with 53% invested there. Strong returns in the first half of 2018 were driven by this exposure. Jason focuses on analysing the functionality of industrial units for the potential tenants. He believes that valuations are increasingly tight in industrials although there are still opportunities.
One of the attractions of the sector is its relative resilience to poor economic news, he says. Jason adds that valuations and the upcoming rupture date in March means he is "investing with ever greater caution". Jason holds just 14% of his portfolio in the retail sector, with most of that in retail warehouses. The trust trades close to par with a dividend yield of 5.2%.
UK Commercial Property REIT has been transformed by the manager, Will Fulton, since he took over in 2015. Reducing exposure to retail has been one of his key changes, and the trust just sold another retail property worth £23.5 million in October, further reducing its weighting.
Will has retained 20% of the trust in retail warehouses, but by our calculations the weighting to traditional retail is now below 10%. Will has also reduced the trust's exposure to central London office space, which helped the trust perform well in 2016 and 2017, and he remains bearish on that space. The trust trades on a discount of 6.6% and has a dividend yield of 4.2%.
Kepler Partners is a third-party supplier and not part of interactive investor. Neither Kepler Partners or interactive investor will be responsible for any losses that may be incurred as a result of a trading idea.
Full performance can be found on the company or index summary page on the interactive investor website. Simply click on the company's or index name highlighted in the article.
Important Information
Kepler Partners is not authorised to make recommendations to Retail Clients. This report is based on factual information only, and is solely for information purposes only and any views contained in it must not be construed as investment or tax advice or a recommendation to buy, sell or take any action in relation to any investment.
This report has been issued by Kepler Partners LLP solely for information purposes only and the views contained in it must not be construed as investment or tax advice or a recommendation to buy, sell or take any action in relation to any investment. If you are unclear about any of the information on this website or its suitability for you, please contact your financial or tax adviser, or an independent financial or tax adviser before making any investment or financial decisions.
The information provided on this website is not intended for distribution to, or use by, any person or entity in any jurisdiction or country where such distribution or use would be contrary to law or regulation or which would subject Kepler Partners LLP to any registration requirement within such jurisdiction or country. Persons who access this information are required to inform themselves and to comply with any such restrictions. In particular, this website is exclusively for non-US Persons. The information in this website is not for distribution to and does not constitute an offer to sell or the solicitation of any offer to buy any securities in the United States of America to or for the benefit of US Persons.
This is a marketing document, should be considered non-independent research and is subject to the rules in COBS 12.3 relating to such research. It has not been prepared in accordance with legal requirements designed to promote the independence of investment research.
No representation or warranty, express or implied, is given by any person as to the accuracy or completeness of the information and no responsibility or liability is accepted for the accuracy or sufficiency of any of the information, for any errors, omissions or misstatements, negligent or otherwise. Any views and opinions, whilst given in good faith, are subject to change without notice.
This is not an official confirmation of terms and is not to be taken as advice to take any action in relation to any investment mentioned herein. Any prices or quotations contained herein are indicative only.
Kepler Partners LLP (including its partners, employees and representatives) or a connected person may have positions in or options on the securities detailed in this report, and may buy, sell or offer to purchase or sell such securities from time to time, but will at all times be subject to restrictions imposed by the firm's internal rules. A copy of the firm's conflict of interest policy is available on request.
Past performance is not necessarily a guide to the future. The value of investments can fall as well as rise and you may get back less than you invested when you decide to sell your investments. It is strongly recommended that Independent financial advice should be taken before entering into any financial transaction.
PLEASE SEE ALSO OUR TERMS AND CONDITIONS
Kepler Partners LLP is a limited liability partnership registered in England and Wales at 9/10 Savile Row, London W1S 3PF with registered number OC334771.
Kepler Partners LLP is authorised and regulated by the Financial Conduct Authority.
Kepler Partners is a third-party supplier and not part of interactive investor. Neither Kepler Partners or interactive investor will be responsible for any losses that may be incurred as a result of a trading idea.
These articles are provided for information purposes only. Occasionally, an opinion about whether to buy or sell a specific investment may be provided by third parties. The content is not intended to be a personal recommendation to buy or sell any financial instrument or product, or to adopt any investment strategy as it is not provided based on an assessment of your investing knowledge and experience, your financial situation or your investment objectives. The value of your investments, and the income derived from them, may go down as well as up. You may not get back all the money that you invest. The investments referred to in this article may not be suitable for all investors, and if in doubt, an investor should seek advice from a qualified investment adviser.
Full performance can be found on the company or index summary page on the interactive investor website. Simply click on the company's or index name highlighted in the article.
Important Information
Kepler Partners is not authorised to make recommendations to Retail Clients. This report is based on factual information only, and is solely for information purposes only and any views contained in it must not be construed as investment or tax advice or a recommendation to buy, sell or take any action in relation to any investment.
This report has been issued by Kepler Partners LLP solely for information purposes only and the views contained in it must not be construed as investment or tax advice or a recommendation to buy, sell or take any action in relation to any investment. If you are unclear about any of the information on this website or its suitability for you, please contact your financial or tax adviser, or an independent financial or tax adviser before making any investment or financial decisions.
The information provided on this website is not intended for distribution to, or use by, any person or entity in any jurisdiction or country where such distribution or use would be contrary to law or regulation or which would subject Kepler Partners LLP to any registration requirement within such jurisdiction or country. Persons who access this information are required to inform themselves and to comply with any such restrictions. In particular, this website is exclusively for non-US Persons. The information in this website is not for distribution to and does not constitute an offer to sell or the solicitation of any offer to buy any securities in the United States of America to or for the benefit of US Persons.
This is a marketing document, should be considered non-independent research and is subject to the rules in COBS 12.3 relating to such research. It has not been prepared in accordance with legal requirements designed to promote the independence of investment research.
No representation or warranty, express or implied, is given by any person as to the accuracy or completeness of the information and no responsibility or liability is accepted for the accuracy or sufficiency of any of the information, for any errors, omissions or misstatements, negligent or otherwise. Any views and opinions, whilst given in good faith, are subject to change without notice.
This is not an official confirmation of terms and is not to be taken as advice to take any action in relation to any investment mentioned herein. Any prices or quotations contained herein are indicative only.
Kepler Partners LLP (including its partners, employees and representatives) or a connected person may have positions in or options on the securities detailed in this report, and may buy, sell or offer to purchase or sell such securities from time to time, but will at all times be subject to restrictions imposed by the firm's internal rules. A copy of the firm's conflict of interest policy is available on request.
Past performance is not necessarily a guide to the future. The value of investments can fall as well as rise and you may get back less than you invested when you decide to sell your investments. It is strongly recommended that Independent financial advice should be taken before entering into any financial transaction.
PLEASE SEE ALSO OUR TERMS AND CONDITIONS
Kepler Partners LLP is a limited liability partnership registered in England and Wales at 9/10 Savile Row, London W1S 3PF with registered number OC334771.
Kepler Partners LLP is authorised and regulated by the Financial Conduct Authority.
These articles are provided for information purposes only. Occasionally, an opinion about whether to buy or sell a specific investment may be provided by third parties. The content is not intended to be a personal recommendation to buy or sell any financial instrument or product, or to adopt any investment strategy as it is not provided based on an assessment of your investing knowledge and experience, your financial situation or your investment objectives. The value of your investments, and the income derived from them, may go down as well as up. You may not get back all the money that you invest. The investments referred to in this article may not be suitable for all investors, and if in doubt, an investor should seek advice from a qualified investment adviser.
Full performance can be found on the company or index summary page on the interactive investor website. Simply click on the company's or index name highlighted in the article.