Trust discounts: where investors can snap up a bargain
17th September 2021 14:24
A Kepler analyst reviews its discounted opportunities portfolio, with one trust rallying more than 30% in two months.

This content is provided by Kepler Trust Intelligence, an investment trust focused website for private and professional investors. Kepler Trust Intelligence is a third-party supplier and not part of interactive investor. It is provided for information only and does not constitute a personal recommendation.
Material produced by Kepler Trust Intelligence should be considered a marketing communication, and is not independent research.
We last updated our discounted opportunities portfolio in July. Since then markets have been grinding higher but discounts have not moved – and perhaps slightly widened. We think readers will largely agree that it is hard to have conviction about the direction of markets and leadership at the moment, which may explain the static picture regarding discounts. At a directional level, the easy gains in the recovery have been made, and government support schemes have still to be wound down, creating uncertainty about the real health of companies and economies.
At the market leadership level, the growth/value distinction was the main driver of markets from the start of the pandemic to the end of the reflationary rally in the first quarter of 2021. Since then, the degree of divergence of the relative returns of the two styles has fallen, and we would argue it is not clear it will drive markets to the same extent over the coming months. One possibility we have been alluding to over the past year is that after the initial recovery, it will be quality that is the most attractive characteristic, as economies are likely to be struggling with the impact of the pandemic for some time to come, despite the optimism of the relief rally. Supply chain issues, wage inflation and declining macro data from the US and China are all possible indications of a more troubled period to come.
We think this is more than a summer lull, therefore. One weight on sentiment is likely to be concerns about the impact of the Delta wave, which was only really picking up steam at the start of the period. If this is the case, the current ‘back to school’ period could be key. If the UK and Europe manage to open schools and return to the office without kicking off a new wave that needs to be controlled via lockdowns, this could be the catalyst for a fresh wave of optimism. Yet with support schemes in the UK winding down at the same time, it is hard to call how everything will play out.
Market review
Since our last review on 14 July, the UK’s recovery rally has slowed, and the FTSE All-Share’s total return of 1.9% is below the 3.5% of the MSCI ACWI. Morningstar’s universe of investment companies has enjoyed NAV total returns of 2.2% over the period and share price total returns of 2.8%. The discount has narrowed slightly over the period. JPMorgan Cazenove’s more restricted universe of investment trusts has seen slightly lower numbers for both return series, with discounts ending up roughly where they started at around 3.6% on a weighted average basis compared to 3.5% on the 14 July.
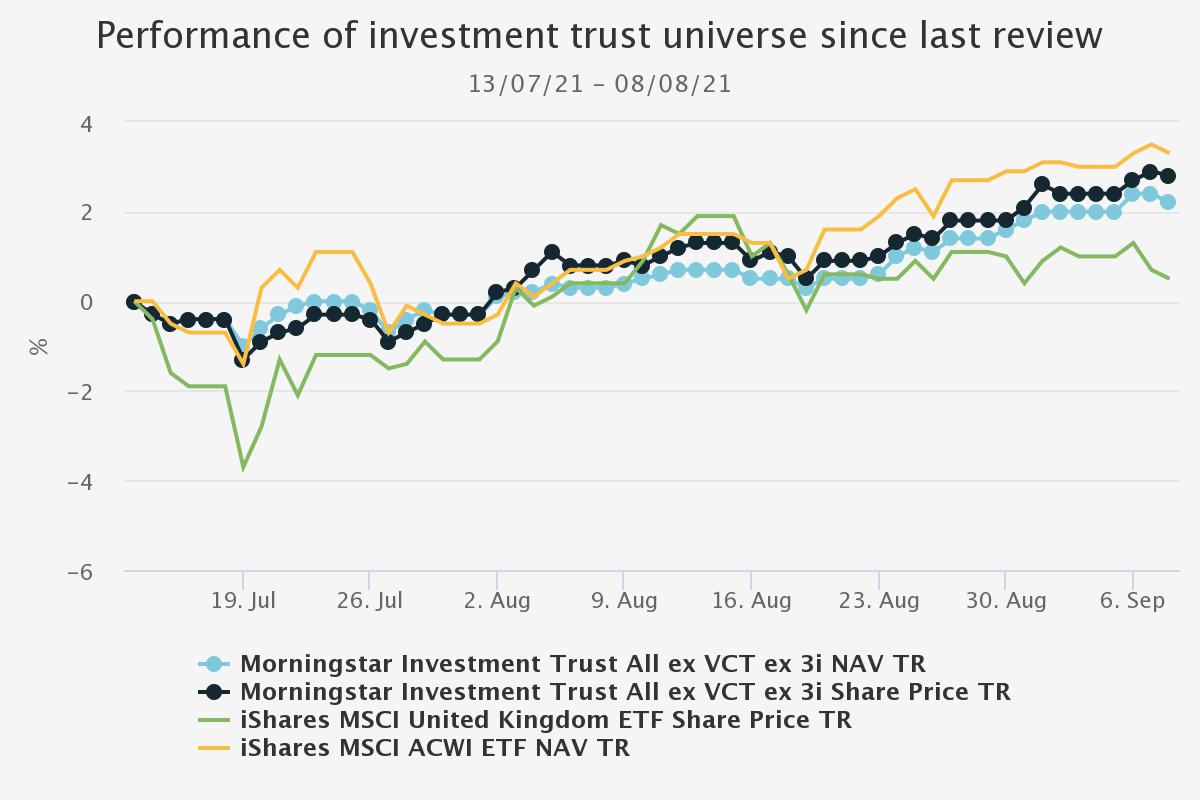
Source: Morningstar. Past performance is not a reliable indicator of future results
On a sector level, the best NAV returns have come from the two infrastructure securities trusts . They have slightly outperformed the India sector, while the Japanese sectors are close behind. There has also been something of a revival for the environmental sector. After performing well in late 2020 on the expectation of green stimulus measures, the sector traded sideways for the first half of 2021. Since the start of July, it has enjoyed a decent rally. Our portfolio constituent Menhaden Resource Efficiency (LSE:MHN) has seen its share price keep up with NAV, although the absolute discount remains attractive at 27%.
The daddy of the sector, Impax Environmental Markets (LSE:IEM) has seen its share price exceed its gains and the premium rise to 6.7%. Jupiter Green (LSE:JGC), however, has seen its discount widen as its shares have not kept up. Since 14 July, NAV is up 7.5% on a total-return basis, but the shares are up just 6%. The discount has widened to 8%. While this is not wide enough for the trust to make it into our portfolio, we do view it as attractively priced and would certainly add it to the list should it widen significantly further. JGC is one of a limited number of trusts investing entirely in the environmental space.
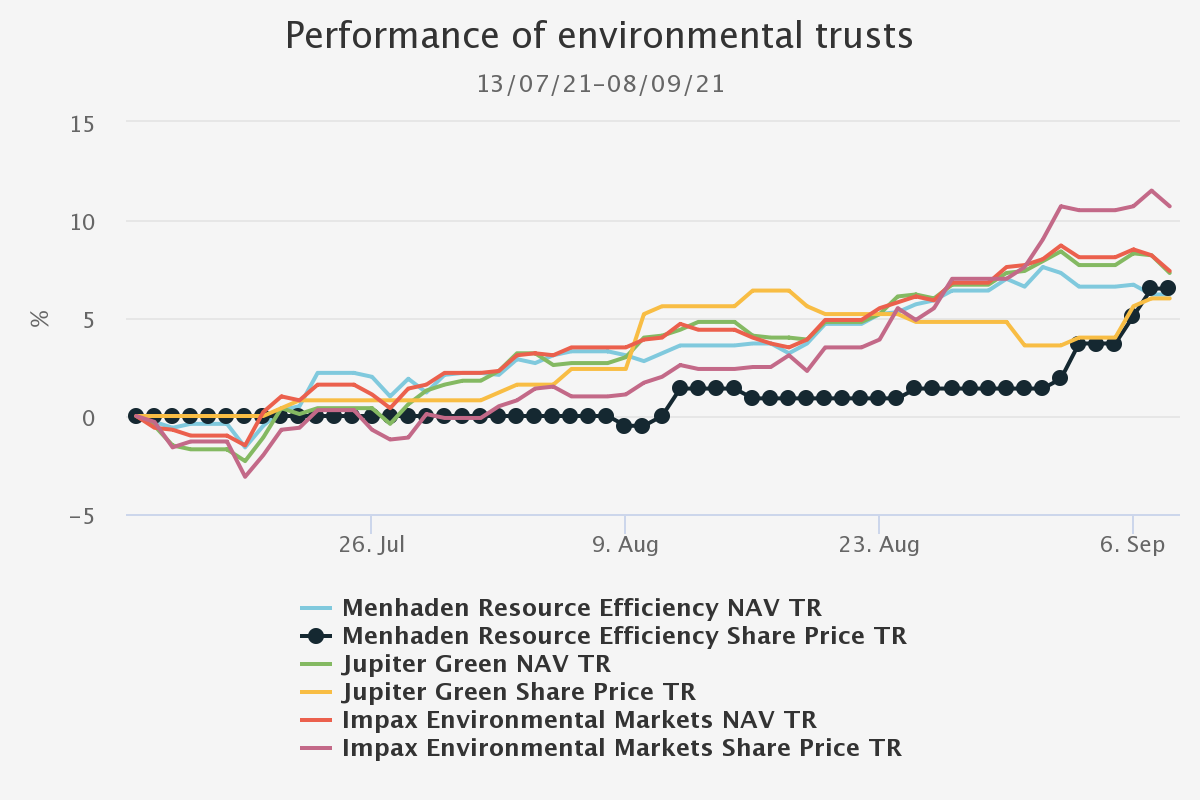
Source: Morningstar. Past performance is not a reliable indicator of future results
Another similar situation has emerged in the two-strong US Smaller Companies sector. Brown Advisory US Smaller Companies (LSE:BASC) has seen its discount drift out to 9%, while its peer JPMorgan US Smaller Companies (LSE:JUSC) is trading just 3.7% below par. BASC has a new manager, which may explain the weakness, although the Brown team have actually outperformed their competitor since 1 April when the manager took over. With both trusts having a quality growth style, we see no good reason for this disparity, but the BASC discount is not quite wide enough for our discounted opportunities portfolio.
Excluding the sectors with many stale NAVs, the environmental sector overall has seen the greatest discount narrowing over the period, making JGC stand out even further as an anomaly. It may be to do with investors taking stock after the recent promotion of Jon Wallace to lead manager and the departure of Charlie Thomas. The other sectors to see their discounts widen are an eclectic bunch, encompassing the flexible infrastructure and European smaller companies sectors. We show the list of sectors below, ordered by the NAV total return during the period.
Performance of sectors since last review
| WEIGHTED DAILY DISCOUNT (%) 14/07/2021 | WEIGHTED DAILY DISCOUNT (%) 08/09/2021 | DISCOUNT NARROWING (PP) | NAV TOTAL RETURN (%) (CUMULATIVE) | ||
| Morningstar Investment Trust Infrastructure Securities | -4.5 | -4.6 | -0.1 | 10 | |
| Morningstar Investment Trust India | -11.5 | -10.5 | 1 | 9.8 | |
| Morningstar Investment Trust Japan | -4.2 | -4.9 | -0.7 | 8.4 | |
| Morningstar Investment Trust Japanese Smaller Companies | -1.4 | -2.3 | -0.9 | 8.3 | |
| Morningstar Investment Trust Environmental | 2.2 | 4.9 | 2.7 | 6.9 | |
| Morningstar Investment Trust European Smaller Companies | -10.6 | -8.8 | 1.8 | 6.3 | |
| Morningstar Investment Trust UK All Companies | -5.2 | -5.4 | -0.2 | 5.7 | |
| Morningstar Investment Trust UK Smaller Companies | -5.3 | -5.2 | 0.2 | 5 | |
| Morningstar Investment Trust Europe | -5.9 | -5.4 | 0.5 | 4.5 | |
| Morningstar Investment Trust Financials | 2.4 | 0.8 | -1.6 | 4.3 | |
| Morningstar Investment Trust Global Smaller Companies | -3.8 | -3.8 | 0.1 | 3.9 | |
| Morningstar Investment Trust Debt - Structured Finance | -6.6 | -5.9 | 0.6 | 3.6 | |
| Morningstar Investment Trust Country Specialist | -11.5 | -15.1 | -3.6 | 3.3 | |
| Morningstar Investment Trust All Asia Pacific | -4.8 | -5.7 | -0.8 | 3.2 | |
| Morningstar Investment Trust Asia Pacific Smaller Companies | -8.2 | -8.5 | -0.3 | 2.9 | |
| Morningstar Investment Trust Technology & Media | 374.2 | -6 | -380.1 | 2.6 | |
| Morningstar Investment Trust Property Securities | -2.4 | -0.8 | 1.6 | 2.5 | |
| Morningstar Investment Trust North American Smaller Companies | -3.6 | -6.3 | -2.6 | 2.4 | |
| Morningstar Investment Trust Global | -2.4 | -4.3 | -1.8 | 2.3 | |
| Morningstar Investment Trust Leasing | -10.4 | -4.3 | 6.1 | 2.3 | |
| Morningstar Investment Trust Global Emerging Markets | -7 | -7.5 | -0.5 | 2.2 | |
| Morningstar Investment Trust Hedge Funds | -13.9 | -17 | -3.1 | 2.2 | |
| Morningstar Investment Trust North America | -3.3 | -5.6 | -2.3 | 2.1 | |
| Morningstar Investment Trust Growth Capital | 3.7 | 13.2 | 9.4 | 2 | |
| Morningstar Investment Trust Asia Pacific | -3.8 | -4.5 | -0.7 | 1.8 | |
| Morningstar Investment Trust Commodities & Natural Resources | -7 | -9.8 | -2.8 | 1.7 | |
| Morningstar Investment Trust Royalties | 2.9 | 6.2 | 3.4 | 1.5 | |
| Morningstar Investment Trust Property - UK Healthcare | 8.2 | 7.7 | -0.4 | 1.5 | |
| Morningstar Investment Trust Debt - Direct Lending | -3.7 | -3.9 | -0.2 | 1.5 | |
| Morningstar Investment Trust UK Equity & Bond Income | -5.5 | -4 | 1.5 | 1.4 | |
| Morningstar Investment Trust Flexible Investment | -11.5 | -9.3 | 2.2 | 1.3 | |
| Morningstar Investment Trust Liquidity Funds | -0.7 | -1 | -0.3 | 1.1 | |
| Morningstar Investment Trust Debt - Loans & Bonds | -3.9 | -3.9 | 0 | 1.1 | |
| Morningstar Investment Trust Global Equity Income | -0.7 | -1.9 | -1.3 | 1 | |
| Morningstar Investment Trust UK Equity Income | -2.5 | -3.1 | -0.7 | 1 | |
| Morningstar Investment Trust Renewable Energy Infrastructure | 9.9 | 10.3 | 0.4 | 1 | |
| Morningstar Investment Trust Property - UK Commercial | -5.5 | -5.5 | 0 | 0.9 | |
| Morningstar Investment Trust Property - Europe | -12.3 | -16.5 | -4.2 | 0.9 | |
| Morningstar Investment Trust Insurance & Reinsurance Strategies | -17.9 | -17.9 | 0 | 0.8 | |
| Morningstar Investment Trust Private Equity | 0.1 | 8.6 | 8.5 | 0.8 | |
| Morningstar Investment Trust Biotechnology & Healthcare | 3.7 | -1.4 | -5 | 0.7 | |
| Morningstar Investment Trust Property - UK Residential | 3.1 | 3.4 | 0.2 | 0.6 | |
| Morningstar Investment Trust Infrastructure | 14.5 | 16.3 | 1.8 | 0.5 | |
| Morningstar Investment Trust Private Equity ex 3i | -15.7 | -11.7 | 4 | 0.5 | |
| Morningstar Investment Trust Property - UK Logistics | 9 | 21.4 | 12.4 | 0.4 | |
| Morningstar Investment Trust Property - Rest of the World | -42.9 | -43.1 | -0.2 | 0.3 | |
| Morningstar Investment Trust Property - Debt | -6.2 | -2.6 | 3.5 | 0.1 | |
| Morningstar Investment Trust Farmland & Forestry | -31.8 | -31.8 | 0 | 0 | |
| Morningstar Investment Trust Asia Pacific Equity Income | -2.2 | -3.1 | -0.9 | -2 | |
| Morningstar Investment Trust Latin America | -11.9 | -10.5 | 1.3 | -7 | |
| Morningstar Investment Trust China/Greater China | -3.6 | -5.4 | -1.9 | -8.6 |
Source: Morningstar. Past performance is not a reliable indicator of future returns
Portfolio review
As a reminder, our discounted opportunities portfolio contains a series of trusts we think trade on wide discounts, which represent an opportunity. First and foremost, however, they are trusts that we think have strong NAV potential. Investing in trusts on the basis of the discount potential alone is a risky business, given the potential for non-investment events to drive discounts – corporate action, illiquid shareholder registers, etc. As a result, our portfolio contains trusts where we think strong NAV gains could be accompanied by a discount narrowing, creating excellent return potential. Investors should be aware, however, that there is no guarantee that our instincts will be proven correct!
That said, it is pleasing to report that the portfolio has performed extremely well on a NAV total return basis, the average being 4.7% since our last report. This is substantially higher than both UK and global indices have managed during the period. Share price returns were even better, with an average gain of 9% over the period. The median was 6.9%, indicating that these gains have not been equally shared.
The standout performer in share price terms was Riverstone Energy (LSE:RSE). The discount has come in from 50.5% to 34% over the period. RSE’s NAV has not been revalued during the period, but the shares have rallied over 30%. While there was no new NAV inspiring this move, the company did publish semi-annual results for the period ending 30 June, which included some details and commentary which may have increased demand for the shares. These included the announcement of new investment in battery assets, increasing the exposure to the energy transition which is at the core of our long thesis on the discount. RSE now has 28% of its portfolio in clean energy investments, with 44% in the legacy energy and petroleum investments. In our view, the decarbonisation theme is so important, and investment opportunities are so sought after that there is a good chance of a significant re-rating close to par. In the meantime, there is a potential realisation opportunity by the end of 2022 if investors are not satisfied with the new strategy.
Kepler discounted opportunities portfolio performance
| DISCOUNT (%) (CUM FAIR) 14/07/2021 | DISCOUNT (%) (CUM FAIR) 08/09/2021 | DISCOUNT NARROWING (PP) | SHARE PRICE TOTAL RETURN (%) (CUMULATIVE) | NAV TOTAL RETURN (%) (CUMULATIVE) | EXCESS RETURN (%) (CUMULATIVE) | ||
| Riverstone Energy (LSE:RSE) | -50.5 | -32.7 | 17.9 | 34.3 | 0 | 8.2 | |
| NB Private Equity Partners (LSE:NBPE) | -27.4 | -20.4 | 7 | 9.3 | 2.1 | -1.3 | |
| Aberdeen Smaller Companies Income (LSE:ASCI) | -16.3 | -12.6 | 3.7 | 13.8 | 7.7 | 3 | |
| Schroder Japan Growth (LSE:SJG) | -12.8 | -12.3 | 0.5 | 6.6 | 6.8 | 0.2 | |
| Menhaden Resource Efficiency (LSE:MHN) | -27.6 | -27.5 | 0.1 | 6.5 | 6.2 | 3.5 | |
| Scottish Oriental Smaller Cos (LSE:SST) | -13.6 | -13.7 | -0.2 | 3.8 | 3.6 | 1.9 | |
| Aberdeen Standard Asia Focus (LSE:AAS) | -12.4 | -13.1 | -0.7 | 3.9 | 3.6 | 3.1 | |
| Downing Strategic Micro-Cap Inv (LSE:DSM) | -14.8 | -16.1 | -1.3 | 7.5 | 8.4 | 7.1 | |
| Oakley Capital Investments (LSE:OCI) | -19.4 | -21 | -1.7 | -2.8 | 0 | -1.8 | |
| CC Japan Income & Growth (LSE:CCJI) | -10.3 | -12.2 | -1.9 | 7.1 | 8.3 | 1.7 | |
| Average | -20.5 | -18.2 | 2.3 | 9 | 4.7 | 2.6 | |
| Median | -15.5 | -14.9 | 0 | 6.9 | 4.9 | 2.4 |
Source: Morningstar. Past performance is not a reliable indicator of future results
The second strongest discount narrowing seen was by NB Private Equity Partners (LSE:NBPE), another not to have reported a NAV. However, its share price appreciation of 9% was well ahead of the 4.3% growth in the S&P500 (it has a US-focussed portfolio). Yet it still trades on a discount wider than 20% - and using Numis’ estimate of the current NAV, the discount is slightly wider than that in the table, at 22.4%. Aberdeen Smaller Companies Income (LSE:ASCI) also saw significant discount narrowing, to 12.6% from 16.3%. While the NAV performed very strongly, share price gains exceeded it. Both ASCI and its stablemate Standard Life UK Smaller Companies have been amongst the best performing UK smaller companies trusts over the past three months as growth has recovered against value.
Aside from these three, discount moves have been fairly muted, averaging 2.3% with a median of essentially no move (0.1%). This is in line with the general picture on the market as a whole discussed above where discounts haven’t moved much. While NBPE saw high demand for its shares, the other private equity trust on our list, Oakley Capital Investments (LSE:OCI), has seen its discount widen by 1.7 percentage points. On a discount of 21%, one of the widest in our portfolio, the shares look particularly good value to us. OCI’s portfolio is full of digital disruptors in the education, consumer and technology sectors. CC Japan Income & Growth (LSE:CCJI)saw slightly more discount widening: 2.9 percentage points. Japanese equities have generally been out of favour in the past few months, with the country struggling to shake off the pandemic and the prime minister announcing his resignation. This has reversed at the start of September, as the leading candidate to replace Suga promises more fiscal stimulus and low-interest rates for longer. It has been growth strategies that have benefitted the most in this bounce, but CCJI is still well-positioned to benefit from the improving corporate governance culture in Japan, which includes a growing dividend culture.
Conclusions and event preview
The summer period has represented a lull after a healthy recovery period for markets since the nadir of the pandemic. As a result, discounts look full overall, with investors having to look hard for opportunities in specific trusts. With that search in mind, our autumn conference on 30 September ‘Now that’s what I call a discount!’ , will these the managers of six investment trusts trading on significant discounts discussing the opportunity which they see and the potential for a narrower discount that might accompany it. Please sign up using the above link.
We see no reason to make any changes to our portfolio. No new trusts have hit our target levels (see table below), while there have been no outstanding opportunities emerge. We do think both Jupiter Green and Brown Advisory US Smaller Companies look attractively cheap compared to similar peers, but neither discounts are quite wide enough for this portfolio.
Discounted opportunity portfolio and target discounts
| Trust | Sector | DISCOUNT (CUM FAIR) 08/09/2021 | Target |
| Aberdeen Smaller Companies Income (LSE:ASCI) | AIC UK Smaller Companies | -12.6 | Level with SLS' discount (currently -7.6%) |
| Aberdeen Standard Asia Focus (LSE:AAS) | AIC Asia Pacific Smaller Companies | -13.1 | <5% |
| Downing Strategic Micro-Cap Inv (LSE:DSM) | AIC UK Smaller Companies | -12.2 | Level with UK Smaller Companies sector average (currently -8.6%) |
| Henderson Opportunities (LSE:HOT) | AIC UK All Companies | -16.1 | Par (expect this in cyclical rally) |
| Menhaden Resource Efficiency (LSE:MHN) | AIC Environmental | -27.5 | Level with Global sector average (currently -2.8%) |
| NB Private Equity Partners (LSE:NBPE) | AIC Private Equity | -20.4 | <10% |
| Oakley Capital Investments (LSE:OCI) | AIC Private Equity | -21 | Level with private equity sector average (currently -11%) |
| Riverstone Energy (LSE:RSE) | AIC Commodities & Natural Resources | -32.7 | Par (or wind up) |
| Schroder Japan Growth (LSE:SJG) | AIC Japan | -12.3 | Par |
| Scottish Oriental Smaller Cos (LSE:SST) | AIC Asia Pacific Smaller Companies | -13.7 | <5% |
| AVERAGE | -18.2 | ||
| MEDIAN | -14.9 |
Source: Morningstar, Kepler.
Kepler Partners is a third-party supplier and not part of interactive investor. Neither Kepler Partners or interactive investor will be responsible for any losses that may be incurred as a result of a trading idea.
These articles are provided for information purposes only. Occasionally, an opinion about whether to buy or sell a specific investment may be provided by third parties. The content is not intended to be a personal recommendation to buy or sell any financial instrument or product, or to adopt any investment strategy as it is not provided based on an assessment of your investing knowledge and experience, your financial situation or your investment objectives. The value of your investments, and the income derived from them, may go down as well as up. You may not get back all the money that you invest. The investments referred to in this article may not be suitable for all investors, and if in doubt, an investor should seek advice from a qualified investment adviser.
Full performance can be found on the company or index summary page on the interactive investor website. Simply click on the company's or index name highlighted in the article.
Important Information
Kepler Partners is not authorised to make recommendations to Retail Clients. This report is based on factual information only, and is solely for information purposes only and any views contained in it must not be construed as investment or tax advice or a recommendation to buy, sell or take any action in relation to any investment.
This report has been issued by Kepler Partners LLP solely for information purposes only and the views contained in it must not be construed as investment or tax advice or a recommendation to buy, sell or take any action in relation to any investment. If you are unclear about any of the information on this website or its suitability for you, please contact your financial or tax adviser, or an independent financial or tax adviser before making any investment or financial decisions.
The information provided on this website is not intended for distribution to, or use by, any person or entity in any jurisdiction or country where such distribution or use would be contrary to law or regulation or which would subject Kepler Partners LLP to any registration requirement within such jurisdiction or country. Persons who access this information are required to inform themselves and to comply with any such restrictions. In particular, this website is exclusively for non-US Persons. The information in this website is not for distribution to and does not constitute an offer to sell or the solicitation of any offer to buy any securities in the United States of America to or for the benefit of US Persons.
This is a marketing document, should be considered non-independent research and is subject to the rules in COBS 12.3 relating to such research. It has not been prepared in accordance with legal requirements designed to promote the independence of investment research.
No representation or warranty, express or implied, is given by any person as to the accuracy or completeness of the information and no responsibility or liability is accepted for the accuracy or sufficiency of any of the information, for any errors, omissions or misstatements, negligent or otherwise. Any views and opinions, whilst given in good faith, are subject to change without notice.
This is not an official confirmation of terms and is not to be taken as advice to take any action in relation to any investment mentioned herein. Any prices or quotations contained herein are indicative only.
Kepler Partners LLP (including its partners, employees and representatives) or a connected person may have positions in or options on the securities detailed in this report, and may buy, sell or offer to purchase or sell such securities from time to time, but will at all times be subject to restrictions imposed by the firm's internal rules. A copy of the firm's conflict of interest policy is available on request.
Past performance is not necessarily a guide to the future. The value of investments can fall as well as rise and you may get back less than you invested when you decide to sell your investments. It is strongly recommended that Independent financial advice should be taken before entering into any financial transaction.
PLEASE SEE ALSO OUR TERMS AND CONDITIONS
Kepler Partners LLP is a limited liability partnership registered in England and Wales at 9/10 Savile Row, London W1S 3PF with registered number OC334771.
Kepler Partners LLP is authorised and regulated by the Financial Conduct Authority.