Targeting trust bargains? Here’s some for your watchlist
An analyst at Kepler Trust Intelligence examines performance of his discounted opportunities portfolio.
16th July 2021 14:35
An analyst at Kepler Trust Intelligence examines the performance of his own discounted opportunities portfolio.

This content is provided by Kepler Trust Intelligence, an investment trust focused website for private and professional investors. Kepler Trust Intelligence is a third-party supplier and not part of interactive investor. It is provided for information only and does not constitute a personal recommendation.
Material produced by Kepler Trust Intelligence should be considered a marketing communication, and is not independent research.
Markets had a great first half to 2021 following on from what was a strong 2020, just as we all would have expected during a pandemic, no doubt!
Our discounted opportunities portfolio has performed respectably in the six months to the end of June. We had one great success, with a trust leaving the list after a barnstorming rally, but overall results from a NAV and discount perspective were mixed, as we discuss below. Overall share price ratings are now high in the investment trust space, with deeply discounted opportunities thin on the ground.
Below, we look at the performance of our discounted opportunities portfolio before checking in on the performance of our rated funds, which managed, in aggregate, to grind out positive alpha over the first six months of the year.
Market and discounts review
The first half of the year saw the MSCI ACWI up 11.1% in sterling. The FTSE All-Share made identical returns. Although value did outperform growth overall, it was very much a game of two halves, with growth making a comeback from mid-May. In that month we saw a very positive CPI print in the US (+5% annualised). Given the importance of base effects to this YoY figure, we think this may have represented the peak of inflation during this recovery.
Inflation began to rise again in June 2020 having tumbled during the initial impact of the lockdowns, so the base effect in the coming months will see the rate of growth fall on a year-on-year basis absent a huge month-on-month rise. If this is true, then one of the drivers of the perceived attractiveness of value over growth – higher inflation – would seem to be diminishing. What we may have seen in the recent outperformance of growth over value is the market coming to that conclusion and switching back into growth over value.
As the below chart shows, the FTSE All-Share outperformed and then underperformed in line with the value index, indicating perhaps what has been driving its recent success. The graph is a cumulative relative performance chart, with a rising line indicating outperformance of the MSCI ACWI and vice-versa.
Relative performance of indices in H1
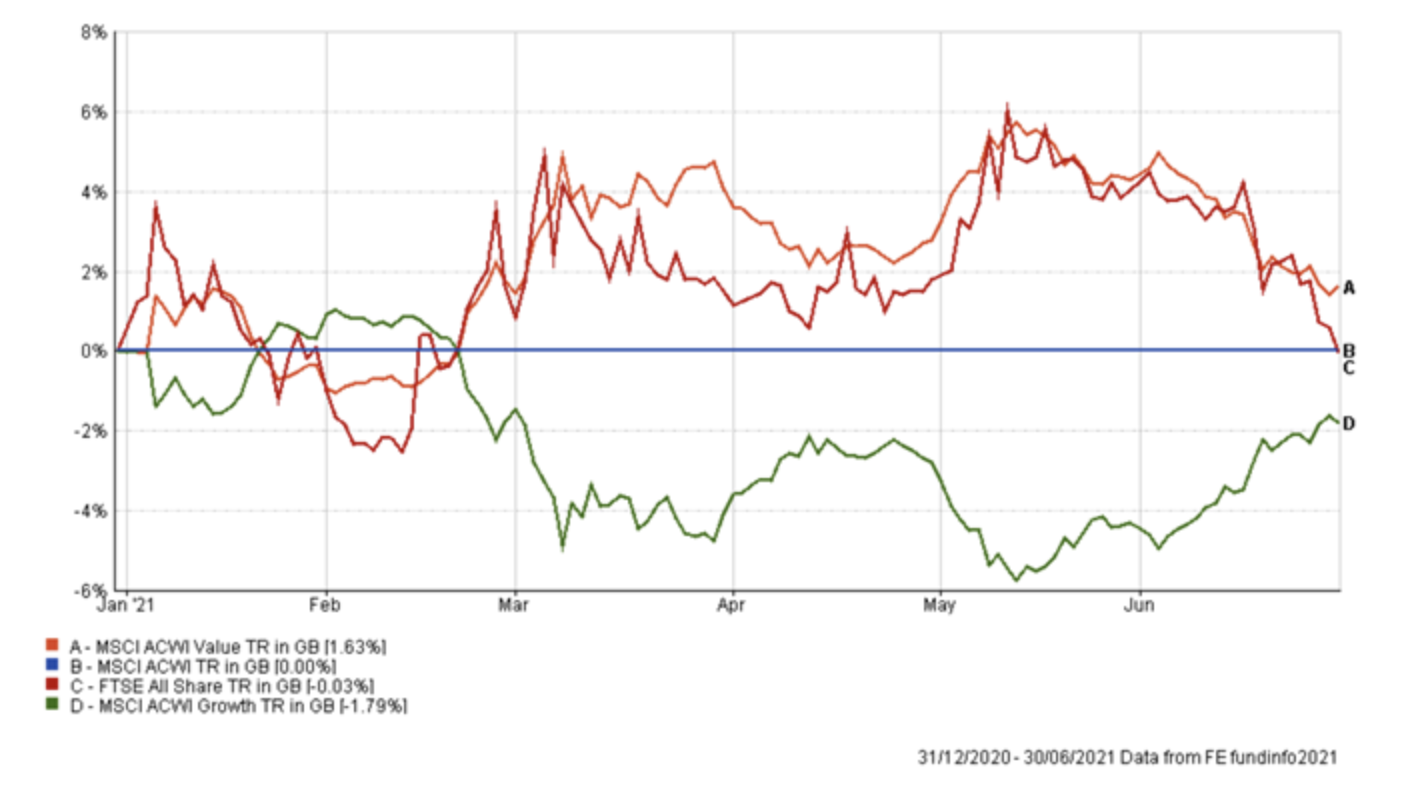
Source: Morningstar
Past performance is not a reliable guide to future returns
As for the discount picture in the investment trust sector, it isn’t particularly attractive overall. The universe (ex VCTs) is now trading on a discount of around 2% on a market cap weighted basis, around the same as it was at the start of the year and marginally behind where it was before the pandemic hit (according to JPMorgan Cazenove figures).
Looking on a sector-by-sector basis, the closing of the discounts in the UK commercial property trusts has been significant, at 5.4 percentage points (Source: JPMorgan Cazenove, Refinitiv data). The smaller UK Residential and European Commercial property sectors have seen comparable moves. There has been modest widening in the Japan sectors, which tend to be dominated by growth strategies, as well as in technology.
The UK sectors have also seen some recent discount widening – perhaps due to profit-taking after the market’s strong run since last October. For our Discounted Opportunities Portfolio we are looking for wide discounts on trusts with good NAV potential too. While these widening discounts may be interesting, they have not thrown up many deep discounts, with the starting valuations already being quite high.
Too HOT to handle
Within our existing portfolio, one of the most dramatic moves we saw in the first half was that of Henderson Opportunities Trust (LSE:HOT), which has hit our target level of par. We introduced HOT into our discounted opportunities portfolio in February 2019. We said: “HOT is a volatile investment. It is consistently significantly geared, and the managers James Henderson and Laura Foll typically run high weightings to the cyclically exposed industrial sector, and also have a liking for picking high-growth technology stocks. It has a structural bias to small and mid-caps…
The trust traded on a premium for much of 2014 when the UK economy was perceived as being strong and the small and mid-caps were outperforming. We believe that the combination of gearing, cyclical exposure, a value tilt and exposure to SMIDs means that it is likely to be used by investors to generate excess returns in the next bull market, whenever that may be, and could well trade on a premium again. In our view, the current discount reflects poor sentiment to the UK, to small and mid-caps, which are seen as domestically focused (largely unjustifiably), and to value.”
Well, the next bull market (of sorts) has been and perhaps gone. We didn’t foresee a reflationary rally following a pandemic as providing the next cyclical upswing, but the effect on HOT’s portfolio was the same. HOT is up 71.7% over the past 12 months in share price terms. Excellent NAV returns of 60% have been outstripped by the share price thanks to a narrowing discount. In May 2021 HOT traded at par for the first time since 2014, in from a discount of circa 15% when we put it in the portfolio. As a result, our target has been met and we have removed the trust from the list. From when we added it on 13 February 2019 to 25 May 2021, the NAV total return was 48.5% and share price total return was 72.2%, illustrating the possible extra juice to returns from buying on a wide discount.
Performance during holding period
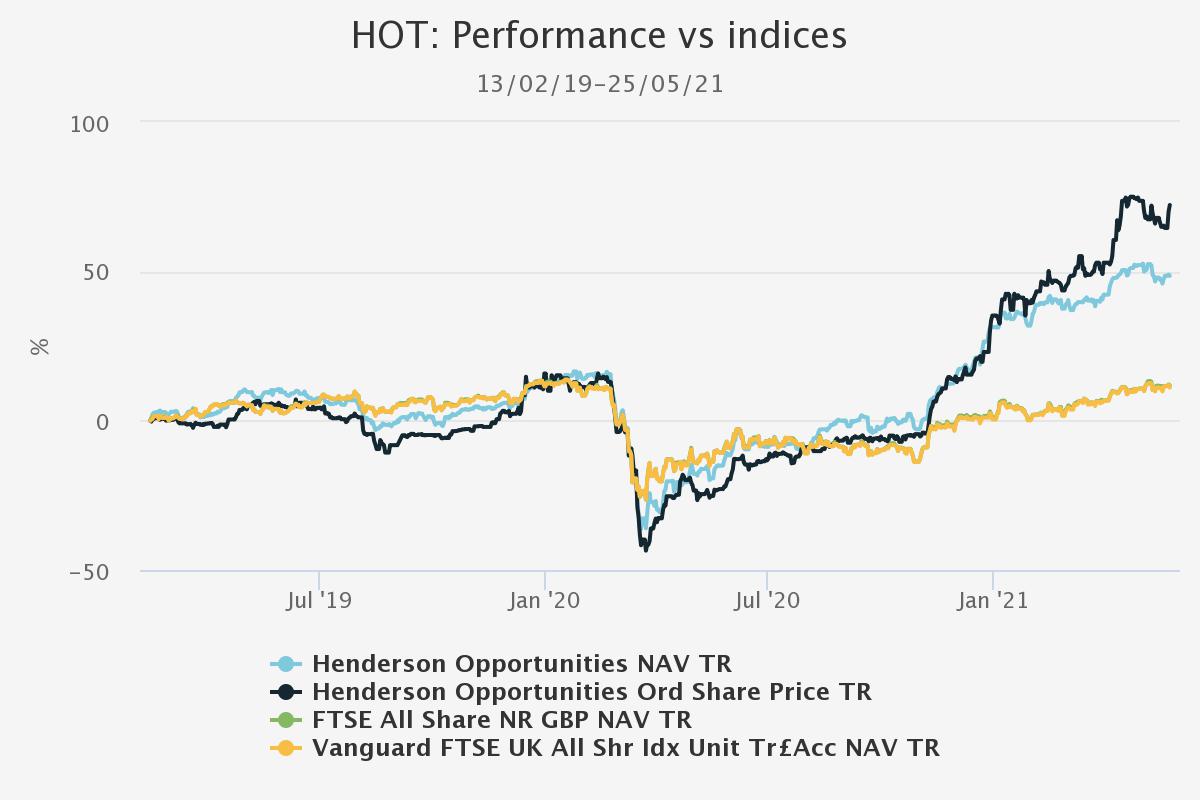
Source: Morningstar
Past performance is not a reliable guide to future returns
Discounted Opportunities Review
HOT is a particular success in an otherwise mixed period for our shortlist. The average discount was 19% at the start of the year and is 18.4% now. The median discount narrowing (excluding HOT, which exited on 25 May) was a hard-to-interpret -0.3 percentage points. Oakley Capital Investments (LSE:OCI) saw the biggest discount narrowing, but this perhaps was a result of its NAV not being updated during the period. Its 22% share price returns were among the best, and marginally ahead of the 23.1% generated by NB Private Equity Partners (LSE:NBPE), another private equity trust which we added in January. NBPE did report NAVs during the period, and has booked an 11.8% NAV total return according to Morningstar. It has therefore seen its discount come in by 6.9%. NBPE’s last NAV was as of 31 May. The FTSE is up 1.3% and the MSCI ACWI 4.8% since then, and we believe it likely the PE trusts’ live NAVs could be higher too, meaning the discounts are slightly understated. We continue to believe they are substantially undervalued given their long-term track records. If we exclude the PE discounts from the list because of the stale NAV issue, then the average discount on our shortlist widened by 1.7 percentage points.
Discounted Opportunities
| DISCOUNT (CUM FAIR) (%) 31/12/2020 | DISCOUNT (CUM FAIR) (%) 06/07/2021 | CHANGE IN DISCOUNT (PP) | SHARE PRICE TR (%) | NAV TR (%) | NAV EXCESS RETURN VS BENCHMARK (CUMULATIVE) (%) | |
|---|---|---|---|---|---|---|
| Aberdeen Smaller Companies Income (LSE:ASCI) | -9.5 | -17.3 | -7.7 | 13 | 23.1 | 3.2 |
| Aberdeen Standard Asia Focus (LSE:AAS) | -10 | -14 | -4.1 | 13.9 | 19.1 | 0.1 |
| CC Japan Income & Growth (LSE:CCJI) | -12.2 | -10.5 | 1.7 | 4.4 | 3.2 | 1.9 |
| Downing Strategic Micro-Cap (LSE:DSM) | -23.3 | -14.9 | 8.4 | 31.9 | 19.8 | 7.6 |
| Henderson Opportunities (LSE:HOT) | -10.7 | -13.3 | -2.6 | 13.2 | 15.5 | 2.8 |
| Menhaden Resource Efficiency (LSE:MHN) | -25.4 | -28.6 | -3.2 | 9.1 | 13.7 | -0.3 |
| NB Private Equity Partners (LSE:NBPE) | -29.2 | -22.2 | 6.9 | 22 | 11.8 | - |
| Oakley Capital Investments (LSE:OCI) | -289 | -13.2 | 157 | 23.1 | 0.6 | - |
| Riverstone Energy (LSE:RSE) | -34.7 | -42.3 | -7.6 | 11.1 | 25.7 | -15.5 |
| Schroder Japan Growth (LSE:SJG) | -12.4 | -12.7 | -0.3 | 5.3 | 4.6 | 3.2 |
| Scottish Oriental Smaller Companies (LSE:SST) | -13.1 | -12.9 | 0.2 | 9.6 | 8.9 | -6.6 |
| AVERAGE | 0.7 | 14.2 | 13.3 | -0.4 | ||
| MEDIAN | -0.3 | 13 | 13.7 | 1.9 |
Source: Morningstar
Excluding OCI and NBPE, the average NAV excess returns versus benchmark was -0.4%. This is biased downwards by Riverstone Energy (LSE:RSE) (see table above), and the median is considerably higher at 1.9%. We outlined our reasons for including RSE in our last update. The trust is shifting into investments with a renewables angle, which we think could improve sentiment. It is also on one of the widest discounts in the IT universe, with a vote on wind-up scheduled in two years’ time.
We see no great opportunities to add to our portfolio and so it remains at 10 trusts, with the target levels listed below.
New discounted opportunities portfolio and target discounts
| SECTOR | DISCOUNT (CUM FAIR) (%) 06/07/2021 | TARGET LEVEL | |
|---|---|---|---|
| Aberdeen Smaller Companies Income | AIC UK Smaller Companies | -17.2 | Level with SLS' discount (currently -3.2%) |
| Aberdeen Standard Asia Focus | AIC Asia Pacific Smaller Companies | -14 | <5% |
| CC Japan Income & Growth | AIC Japan | -10.5 | Par |
| Downing Strategic MicroCap | AIC UK Smaller Companies | -15 | Level with UK Smaller Companies sector average (currently -6%) |
| Menhaden Resource Efficiency | AIC Environmental | -28.6 | Level with Global sector average (currently +4.9%) |
| NB Private Equity Partners | AIC Private Equity | -22.2 | Level with Private equity sector average (currently -13.3%) |
| Oakley Capital Investments | AIC Private Equity | -13.2 | When NAV is updated as at 30 June, level with Private equity sector average (currently - 13.3%) |
| Riverstone Energy | AIC Commodities & Natural Resources | -42.3 | 10% discount (or wind up) |
| Schroder Japan Growth | AIC Japan | -12.5 | Par |
| Scottish Oriental Smaller Companies | AIC Asia Pacific Smaller Companies | -12.9 | <5% |
Source: Morningstar
Review of rated trusts
Kepler’s investment trust ratings seek to identify the top-performing closed-ended funds in the growth, income & growth and alternative income categories. Previously presented only on our retail site, in 2021 we unveiled the lists for professional readers too. Our ratings are designed to capture attractive and persistent performance characteristics and to reward long-term success. Like all quantitative systems they are backward-looking, but we have attempted to reward those trusts which have done well in the context of their own goals and benchmarks, and which have done so for a sustained period. As the selection system is entirely quantitative, it allows us to set aside all personal biases and views – and all commercial relationships – and look at the universe in a purely objective way.
As a quant system, it is inevitably likely to have issues when there is a sudden and rapid change in market leadership. The rotation to value from growth is precisely the sort of environment that could cause a quant screen to stumble. When constructing our system we did look into categorising the universe by style in order to provide a more complete palette and recognise the difficulty for managers with consistent styles to outperform when the market was against them. Critically, we found very few trusts which could reasonably be described as value, such has been the impact of many years of success for growth investors. There is also possible evidence of style drift in some trusts with historically more value exposures. However, by looking at long-term records and for strategies with a track record of long-term alpha and superior downside performance we would hope to moderate the inherent bias for a quant system to favour what has had tailwinds behind it.
The inherent growth bias in our capital growth shortlist is visible in the table below, where a positive score on our own Growth / Value score indicates a greater exposure to the growth style. Given the median score of +3.5 on a scale of -5 to +5, the marginal excess return of 0.2% against the funds’ benchmarks is a pretty decent result in our view. For the bulk of the first half of the year value outperformed growth significantly. Although it is notable much of the move has reversed since mid-May, as discussed above, our figures are to the end of June, so don’t incorporate most of this move.
H1 performance of growth-rated trusts
Source: Morningstar, Kepler calculations
It is striking that the outliers in terms of negative and positive excess returns are both Baillie Gifford managed trusts with a growth strategy. Pacific Horizon (LSE:PHI) has been helped by a high exposure to the outperforming metals and mining industry, while one factor behind Edinburgh Worldwide (LSE:EWI)’s underperformance of the global small cap index has been the big position in Tesla, which is down around 12% year to date. Notably Scottish Mortgage (LSE:SMT) has managed to outperform its global index considerably in NAV terms. However, while the NAV has almost regained its high seen in February, the share price has lagged.
Our income and growth-rated trusts have a value bias, as indicated by their median Growth/Value score of -2.5. It is perhaps unsurprising to see better returns for these trusts in the six-month period given this greater exposure to value. The trusts have managed to eke out an average excess return of 1.3% versus their benchmarks, although this average is biased upwards by the excellent returns for Chelverton UK Dividend Trust (LSE:SDV), which saw NAV appreciation of 43.6% over the first half. (It also has one of the highest exposures to value [judged by our Growth/Value score] across both lists).
H1 performance of income and growth-rated trusts
Source: Morningstar, Kepler calculations
Six months is a short period of time over which to judge performance, but the good performance from both lists is encouraging. When it comes to awarding ratings, we have ignored the discount and focussed on NAV returns which we believe should be the overwhelming driver of share price returns over a longer holding period.
Looking at the NAV performance of our alternative income trusts is slightly less informative given that the NAVs price relatively infrequently in some cases and are also often estimates rather than based on observed market prices. However, the NAV total return was 3.1% on average, thanks to the high dividend yields paid. On a share price basis, the total returns were 1% on average. We saw some weakness in the share prices of renewables trusts during the period. One issue is that many observers are forecasting lower power prices in the UK in years to come thanks to the large amount of capacity coming online. The share price premiums have therefore eroded somewhat. The yield on this selection remains high, at 5.3% on average. Notably Invesco Enhanced Income has merged into City Merchants High Yield over the period, and the resulting trust has been renamed Invesco Bond Income Plus (LSE:BIPS), as it appears in the below list.
H1 performance of alternative income trusts
| ASSOCIATION OF INVESTMENT COMPANIES (AIC) SECTOR | (DISCOUNT)/PREMIUM (%) (07/07/21) | YIELD (%) | NAV TR (%) | SHARE PRICE TR (%) | |
|---|---|---|---|---|---|
| Greencoat UK Wind (LSE:UKW) | Renewable Energy Infrastructure | 10.6 | 5.4 | 7.1 | -3.1 |
| Invesco Bond Income Plus (LSE:BIPS) | Debt - Loans & Bonds | -2.6 | 5.3 | 4.4 | 3.3 |
| Starwood European Real Estate Finance (LSE:SWEF) | Property - Debt | -10.5 | 5.8 | 3.3 | 8 |
| Renewables Infrastructure Group (LSE:TRIG) | Renewable Energy Infrastructure | 12.3 | 5.3 | 3 | 2.8 |
| BBGI Global Infrastructure (LSE:BBGI) | Infrastructure | 24.8 | 4.2 | 2.7 | 2.9 |
| International Public Partnerships (LSE:INPP) | Infrastructure | 14.8 | 4.4 | 2.6 | 0.2 |
| HICL Infrastructure (LSE:HICL) | Infrastructure | 9.7 | 4.9 | 1.6 | -2.3 |
| Bluefield Solar Income Fund (LSE:BSIF) | Renewable Energy Infrastructure | 5.5 | 6.7 | 0 | -3.7 |
| AVERAGE | 8.1 | 5.3 | 3.1 | 1 | |
| MEDIAN | 10.2 | 5.3 | 2.8 | 1.5 |
Source: Morningstar, JPMorgan Cazenove
Conclusions and outlook
It is hard to make the decision to buy when the future looks dark and hard to make yourself sell when things are overheating. The question is whether we are at that point yet. Certainly it is hard to see huge discount opportunities in the IT sector. We have also seen a significant rally in a short period of time, with markets well above their pre-pandemic highs. However, the word on the streets appears to be that operational news from companies is good. This is the general message we are receiving from managers across various equity markets.
Of course, this always has to be taken with a pinch of salt – it’s a rare manager who tells you not to buy his market. Perhaps this is a good time to be focusing on NAV potential rather than looking for bargains? For those dead set on buying cheap, the widening of the Japanese and UK sectors may provide ideas. In fact, we note HOT has already widened out to a 10% discount again – not quite wide enough for it to return to our portfolio yet!
Kepler Partners is a third-party supplier and not part of interactive investor. Neither Kepler Partners or interactive investor will be responsible for any losses that may be incurred as a result of a trading idea.
These articles are provided for information purposes only. Occasionally, an opinion about whether to buy or sell a specific investment may be provided by third parties. The content is not intended to be a personal recommendation to buy or sell any financial instrument or product, or to adopt any investment strategy as it is not provided based on an assessment of your investing knowledge and experience, your financial situation or your investment objectives. The value of your investments, and the income derived from them, may go down as well as up. You may not get back all the money that you invest. The investments referred to in this article may not be suitable for all investors, and if in doubt, an investor should seek advice from a qualified investment adviser.
Full performance can be found on the company or index summary page on the interactive investor website. Simply click on the company's or index name highlighted in the article.
Important Information
Kepler Partners is not authorised to make recommendations to Retail Clients. This report is based on factual information only, and is solely for information purposes only and any views contained in it must not be construed as investment or tax advice or a recommendation to buy, sell or take any action in relation to any investment.
This report has been issued by Kepler Partners LLP solely for information purposes only and the views contained in it must not be construed as investment or tax advice or a recommendation to buy, sell or take any action in relation to any investment. If you are unclear about any of the information on this website or its suitability for you, please contact your financial or tax adviser, or an independent financial or tax adviser before making any investment or financial decisions.
The information provided on this website is not intended for distribution to, or use by, any person or entity in any jurisdiction or country where such distribution or use would be contrary to law or regulation or which would subject Kepler Partners LLP to any registration requirement within such jurisdiction or country. Persons who access this information are required to inform themselves and to comply with any such restrictions. In particular, this website is exclusively for non-US Persons. The information in this website is not for distribution to and does not constitute an offer to sell or the solicitation of any offer to buy any securities in the United States of America to or for the benefit of US Persons.
This is a marketing document, should be considered non-independent research and is subject to the rules in COBS 12.3 relating to such research. It has not been prepared in accordance with legal requirements designed to promote the independence of investment research.
No representation or warranty, express or implied, is given by any person as to the accuracy or completeness of the information and no responsibility or liability is accepted for the accuracy or sufficiency of any of the information, for any errors, omissions or misstatements, negligent or otherwise. Any views and opinions, whilst given in good faith, are subject to change without notice.
This is not an official confirmation of terms and is not to be taken as advice to take any action in relation to any investment mentioned herein. Any prices or quotations contained herein are indicative only.
Kepler Partners LLP (including its partners, employees and representatives) or a connected person may have positions in or options on the securities detailed in this report, and may buy, sell or offer to purchase or sell such securities from time to time, but will at all times be subject to restrictions imposed by the firm's internal rules. A copy of the firm's conflict of interest policy is available on request.
Past performance is not necessarily a guide to the future. The value of investments can fall as well as rise and you may get back less than you invested when you decide to sell your investments. It is strongly recommended that Independent financial advice should be taken before entering into any financial transaction.
PLEASE SEE ALSO OUR TERMS AND CONDITIONS
Kepler Partners LLP is a limited liability partnership registered in England and Wales at 9/10 Savile Row, London W1S 3PF with registered number OC334771.
Kepler Partners LLP is authorised and regulated by the Financial Conduct Authority.