Chart of the week: Review of 2019 tips, winners and losers
Our top technical analyst picks 10 standout trades of 2019 – the ones that worked, and some that didn’t.
30th December 2019 09:22
by John Burford from interactive investor
Our top technical analyst picks 10 standout trades of 2019 – the ones that worked, and some that didn’t.

With this my last COTW for 2019, I thought I would highlight some of my winners and losers to help you assess my performance this year. Remember, the vast majority of these trades were highly contrarian and, crucially, I am a swing trader, not so much a long-term investor.
I have made both long and short calls in this generally very bullish year (FTSE 100 up 16%). Making bearish calls in a bull year was somewhat nervy!
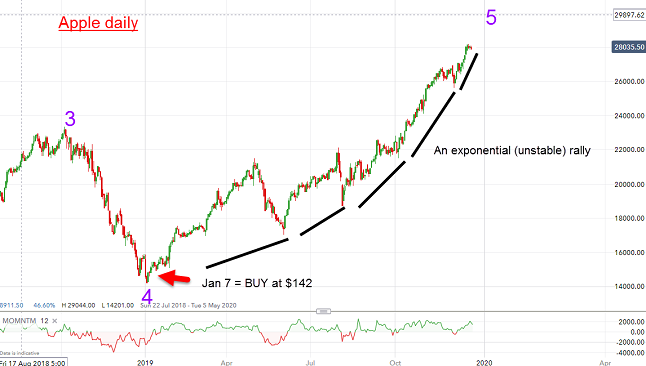
1. I kicked off the year on 7th January in grand style with Apple (NASDAQ:AAPL) with a precision “strong buy” rating at $142. End of year at $280, up 98%. I managed to catch the very low of the correction with no danger to my stop.
Source: interactive investor Past performance is not a guide to future performance
The January dip fell to a solid Fibonacci support in wave 4, and this year has been climbing in the final wave 5 but in a majestic exponential fashion that will burn out at some stage. Taking some profits off the table appears prudent at the very least.
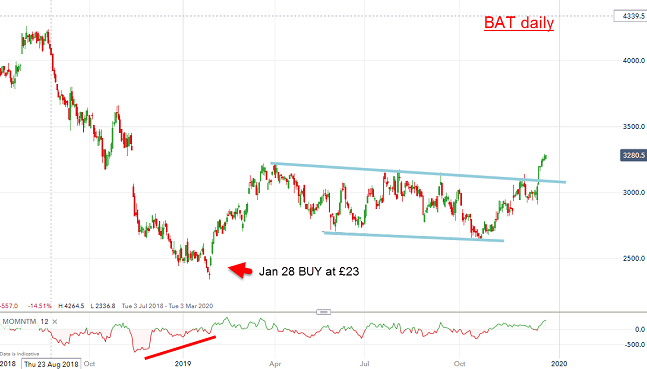
2. And then I went to ‘bat for BAT’, or British American Tobacco (LSE:BATS), on 28th January with a “strong buy” rating as it appeared to be making a significant low in a chart that strongly resembled that of Apple. Amazingly, I forecast a significant rally off that low. This trade was another case of perfect timing.
Source: interactive investor Past performance is not a guide to future performance
Following the initial thrust out of the January low, the shares traded in a range for most of the year but have recently broken up out of the trading channel and are heading for my original target at the £34 level, having hit my first target at £32.
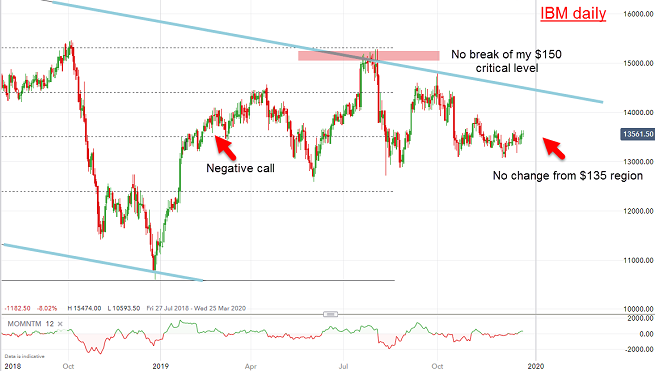
3. I had a negative “sell” rating on IBM (NYSE:IBM) on 11th February, but things did not go exactly to plan.
Source: interactive investor Past performance is not a guide to future performance
This is what I wrote: “The bottom line is that the shares are currently at a crossroads with a likely near term decline ahead that could lead to a re-test of the wave b low at $106. Only a push above the $150 level would cancel out this bearish scenario, which I consider less likely.
In fact, the shares stayed elevated, but below my critical $150 target, and are currently trading at $135, precisely where they traded in February. So, I call that a no-score draw.
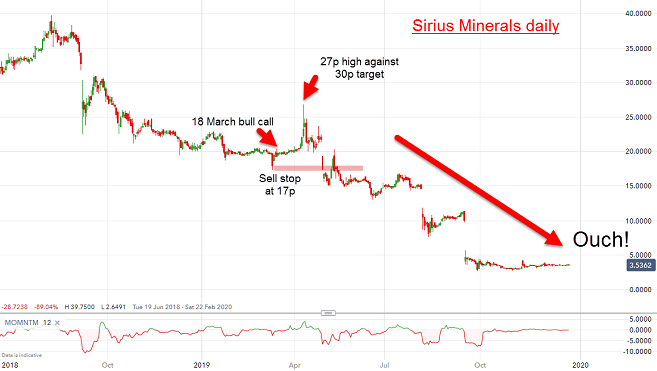
4. But Sirius Minerals (LSE:SXX) on 18th March was a real ‘Burford Bust’, although it briefly moved very close to my cited upper target.
This is what I wrote: “I believe a buy here represents a low risk opportunity and my target is the 30p – 35p area which would close the September gap. There may be higher potential, depending on developments later this year.” And this is the result:
Source: interactive investor Past performance is not a guide to future performance
When posting a “buy” near a low, I always set my protective sell stop just under the low (pink bar) – and it was hit a few days later for a small loss.
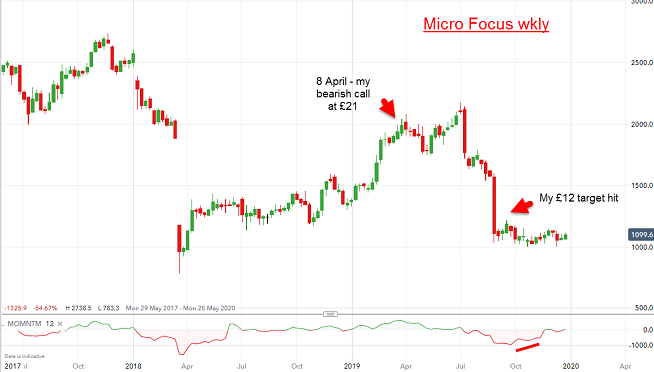
5. I also had a negative call on 8th April on Micro Focus (LSE:MCRO) – a former high-flyer.
This is what I wrote: “So all evidence points to the rally running out of steam here or nearby. Odds very much favour a resumption of the decline. With the shares trading around the £21 area, a reasonable first target is the b wave low at £12 with lower potential thereafter.” This is the current picture:
Source: interactive investor Past performance is not a guide to future performance
My cited target at £12 has been achieved and exceeded, as forecast.
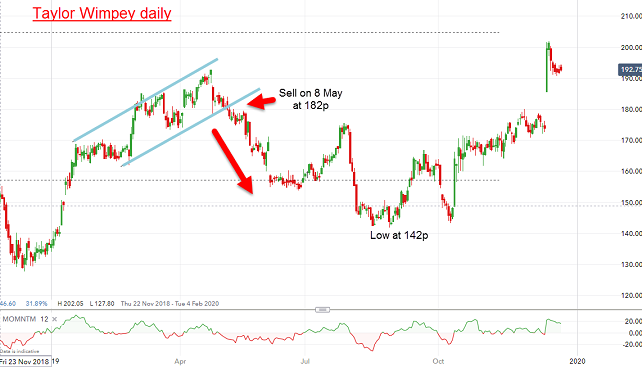
6. And I had another bearish call on 6th May with Taylor Wimpey (LSE:TW.).
This is what I wrote: “The rally has been stunning alright but now at the recent 190 high has hit the Fibonacci 76% retrace and on a growing momentum divergence. Also note the most recent action has been contained inside my small scale blue tramlines. This pattern often appears at the end of a trend. Any break below it would likely send the shares lower.”
Source: interactive investor Past performance is not a guide to future performance
And the break sent the shares lower immediately but only by a decent 22% decline to the summer lows from where they exploded to the upside. A great example of trading the waves (swings).
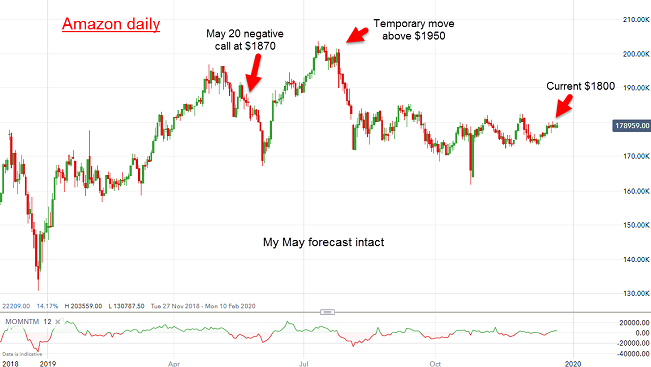
7. And my Amazon (NASDAQ:AMZN) negative call on 20th May remains intact.
This is what I wrote:
“The bottom line is that I expect the shares to decline (currently $1,870) but a move above the $1,950 level would temporarily suspend this outlook.”
Source: interactive investor Past performance is not a guide to future performance
There was an initial decline but then one more push up to just above my cited $1,950 warning level. But that was it – the rally was temporary, and the shares have been in decline since and today trade under my May call.
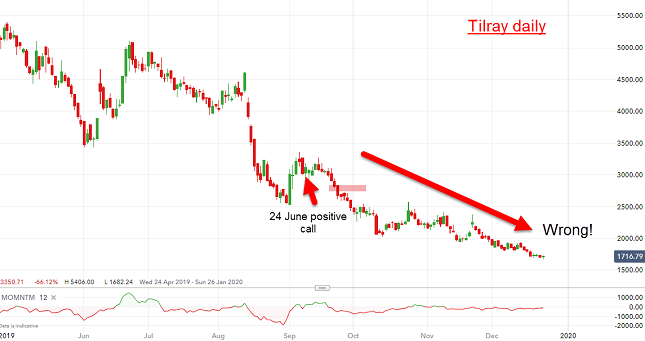
8. And I had another ‘Burford Bust’ in Tilray on 24th June.
This was my call: “From the $35 low, it has rallied to my upper parallel trendline at $50. The move appears to be impulsive, which means the trend is now up and a clear thrust above the upper line would likely send it towards my first target around the $65 - $70 zone. I believe the $35 low will hold on any set-back.”
Source: interactive investor Past performance is not a guide to future performance
But the $35 level did not hold as long liquidation of the entire pot sector continued. The trade was stopped at the pink bar. Not my finest hour.
8. One of my best-timed entries was in BT Group (LSE:BT.A).
This is what I wrote on 16th September:
“If so, I expect a rapid run-up to my first target area around the 250p zone. The recent low at 159p should hold but if not, I would consider moves under this area as an even better opportunity to catch the bottom of red wave 2 that should lead to a ‘long and strong’ wave 3 up. I have a higher target at 340p.”
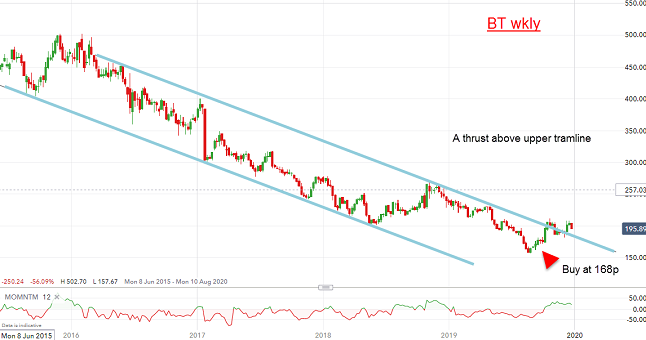
Source: interactive investor Past performance is not a guide to future performance
The shares have pushed above the upper tramline above 200p and only a hard decline back into the trading channel would spoil this bullish picture.
9. My precision contrarian bearish call on Fresnillo (LSE:FRES) on 2nd September was pretty much on the money with the shares topping three days later.
This is what I wrote:
“The shares have retraced a Fibonacci 50% of the most recent decline and could turn down from here.”
This is the result:
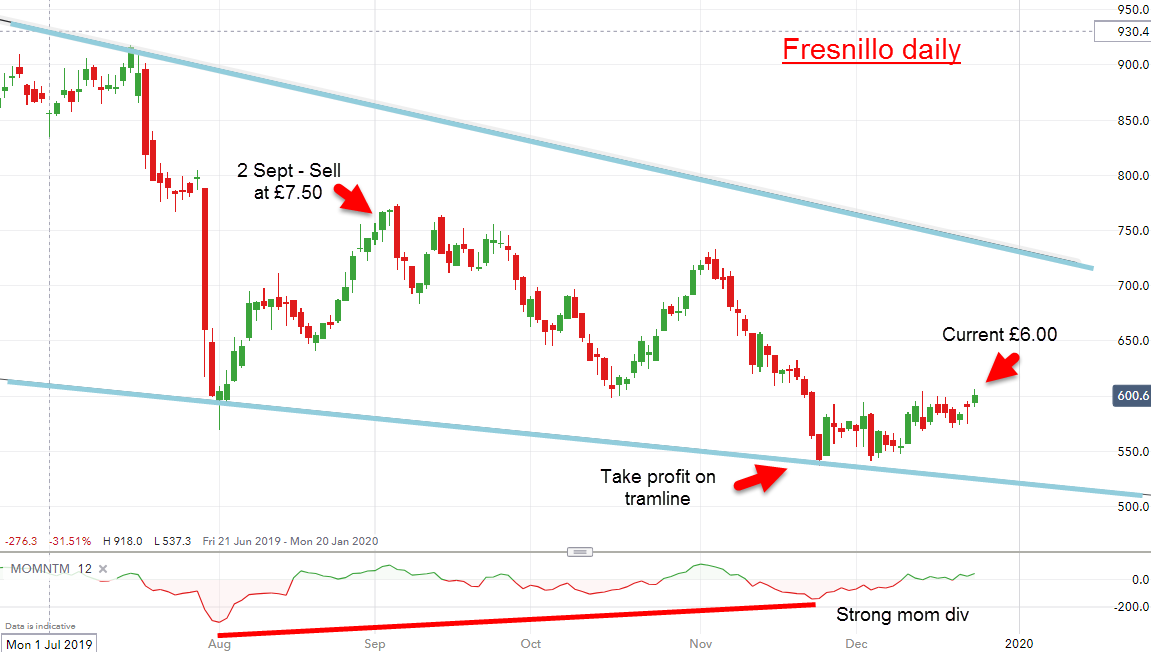
Source: interactive investor Past performance is not a guide to future performance
And when it hit the lower wedge line in November, that was a good opportunity to take profits of about £2 (26%). Currently, the shares are back in rally mode with silver prices advancing strongly. I expect the shares to at least test the upper tramline in the 700p region next year.
10. And finally, for my Contrarian Trade of the Year, my bullish call on Marks & Spencer (LSE:MKS) on 4th November.
This is what I wrote: “...that shows the recent dip has carried to the classic Fibonacci 62% retrace on a momentum divergence. Odds are high that the reversal is nigh and my first target is the £2.50 region. Of course, any re-structuring/take-over developments would very likely send the shares above this level.”
This is the result:
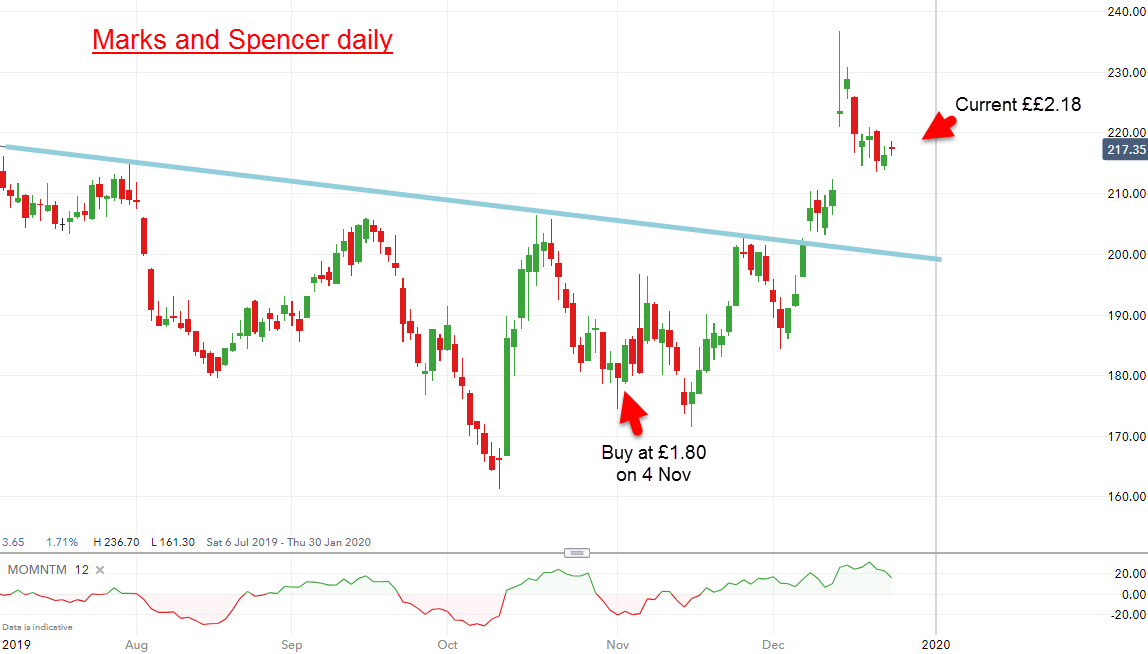
Source: interactive investor Past performance is not a guide to future performance
This was another precision entry and the shares are up 21% to date.
My personal conclusion: Using my Tramline Trading methods, I have been able to achieve many precisely-timed entries this year – both long and short. I have not paid much heed to the ‘story’ behind the shares, except to gauge sentiment which is a critical element in my analysis.
I have observed the iron-clad rule to cut losses early and let the profitable trades run in a disciplined way. I can highly recommend this approach whether you are a swing trader or a long-term investor. To the latter, here is a rather amusing definition of an investment you may recognise: “An investment is a short-term speculation that went wrong.”
Wishing you all a most Prosperous New Year!
For more information about Tramline Traders, or to take a three-week free trial, go to www.tramlinetraders.com.
John Burford is the author of the definitive text on his trading method, Tramline Trading. He is also a freelance contributor and not a direct employee of interactive investor.
These articles are provided for information purposes only. Occasionally, an opinion about whether to buy or sell a specific investment may be provided by third parties. The content is not intended to be a personal recommendation to buy or sell any financial instrument or product, or to adopt any investment strategy as it is not provided based on an assessment of your investing knowledge and experience, your financial situation or your investment objectives. The value of your investments, and the income derived from them, may go down as well as up. You may not get back all the money that you invest. The investments referred to in this article may not be suitable for all investors, and if in doubt, an investor should seek advice from a qualified investment adviser.
Full performance can be found on the company or index summary page on the interactive investor website. Simply click on the company's or index name highlighted in the article.
Disclosure
We use a combination of fundamental and technical analysis in forming our view as to the valuation and prospects of an investment. Where relevant we have set out those particular matters we think are important in the above article, but further detail can be found here.
Please note that our article on this investment should not be considered to be a regular publication.
Details of all recommendations issued by ii during the previous 12-month period can be found here.
ii adheres to a strict code of conduct. Contributors may hold shares or have other interests in companies included in these portfolios, which could create a conflict of interests. Contributors intending to write about any financial instruments in which they have an interest are required to disclose such interest to ii and in the article itself. ii will at all times consider whether such interest impairs the objectivity of the recommendation.
In addition, individuals involved in the production of investment articles are subject to a personal account dealing restriction, which prevents them from placing a transaction in the specified instrument(s) for a period before and for five working days after such publication. This is to avoid personal interests conflicting with the interests of the recipients of those investment articles.