Chart of the week: How to trade Big Blue shares now
Currently at a crossroads, our chartist plots the future for this granddaddy of the global tech industry.
11th February 2019 11:49
by John Burford from interactive investor
Currently at a crossroads, our chartist plots the future for this granddaddy of the global tech industry.

IBM is at a crossroads
International Business Machines (NYSE:IBM) is the granddaddy of the US tech industry. It was the computer pioneer that set the early trends – at least until Microsoft (NASDAQ:MSFT) with its revolutionary Windows software came along. I have fond memories of the IBM 360 mainframe in the mid-sixties when I was a post-grad student. The monster was housed in its own dedicated clean room and only approved personnel were permitted anywhere near the beast.
I punched out cards using Fortran language, handed them to an operator and next morning (if the machine had not broken down) was handed the results. Happy days! But I digress.
Of course, being in the hardware business when software was starting to boom was not a road to riches. Hardware became a commodity when PCs arrived and margins were slashed. That is when IBM shares languished in the wilderness. In 2014 it recorded its lowest quarterly sales ever.
And last year it acquired Red Hat – a software company. Better late than never!
The monthly chart tells the story this century:
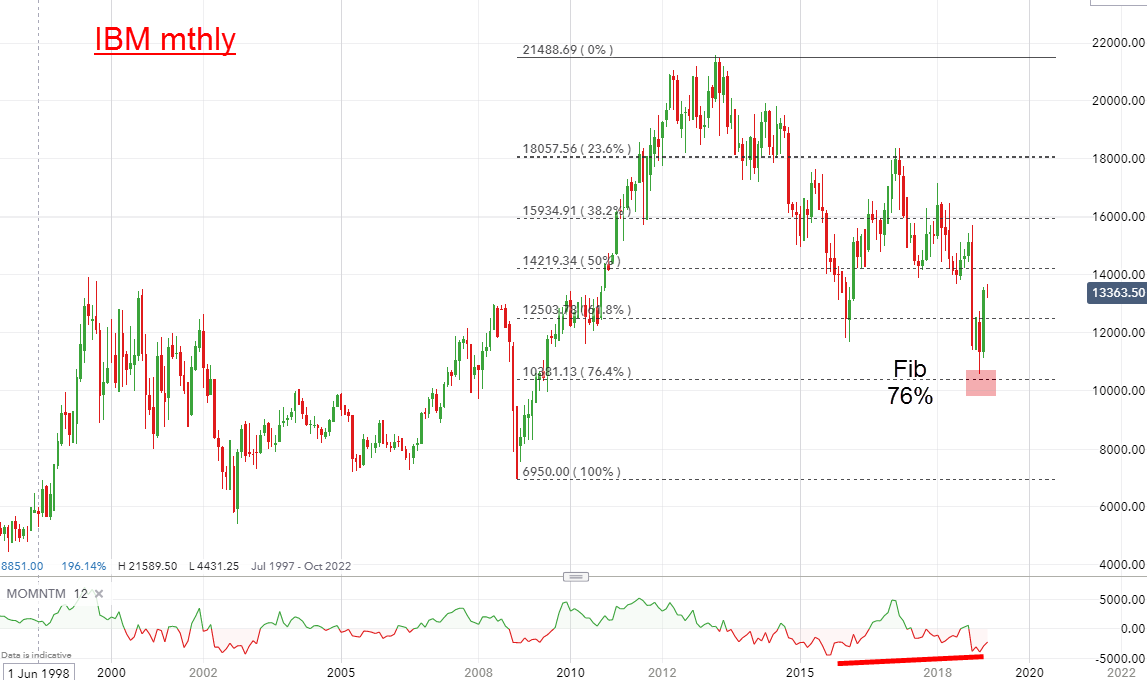
Source: interactive investor Past performance is not a guide to future performance
From the 2009 Credit Crunch low, the shares embarked on a solid advance (as did many other shares, of course) as the new quantitative easing (QE) money found its way onto the stock market.
It made a high of $214 in May 2013 and since then has declined in two major waves to the Fibonacci 76% retrace on a momentum divergence. And that was the ideal setup for a decent bounce, which is currently in progress.
But what is the likelihood for further gains in the near term? After all, odds have now swung to my bearish case for the US indexes (IBM is one of the 30 shares in the DJIA).
Only last week, signs of a major top were signalled. If the indexes are heading south, can IBM be far behind?
For clues, let's zoom in on the shorter time frame:
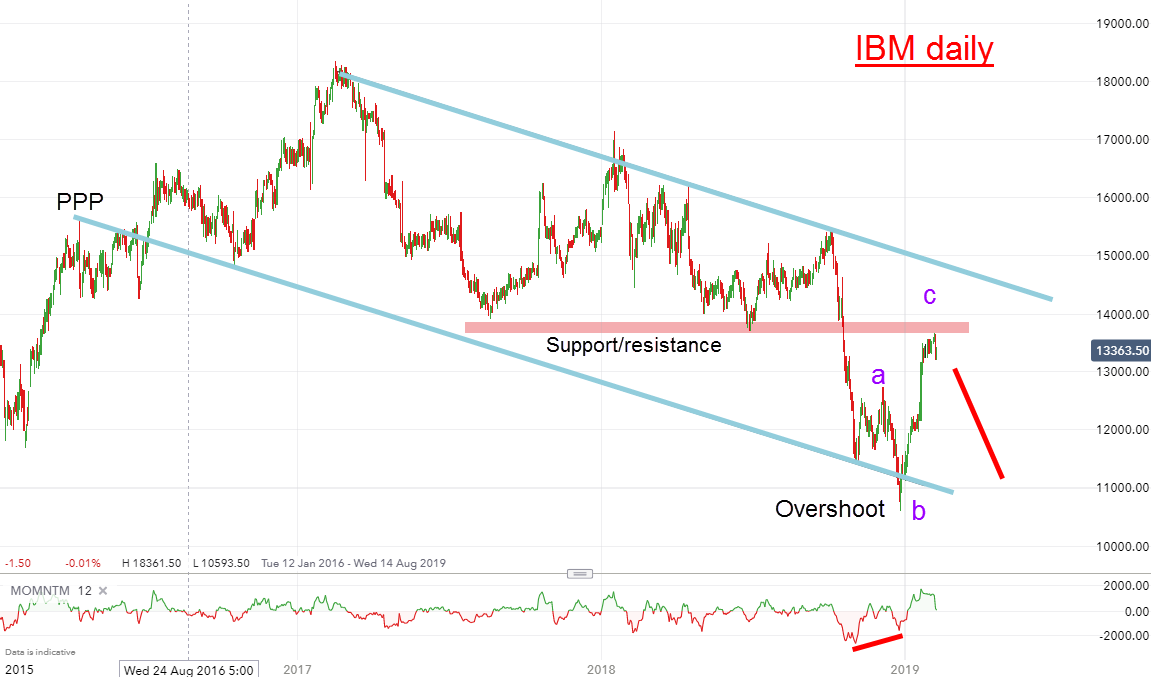
Source: interactive investor Past performance is not a guide to future performance
My tramlines are interesting. The lower one sports a Prior Pivot Point (PPPs are a series of minor lows or highs made before the market enters the trading channel) in April 2016 that anchors that line as support into the future – even over two years (markets have long memories).
The market hit that line in October, bounced in wave a then dipped in wave b, taking it below the line and formed an ‘overshoot'. Overshoots usually are selling climaxes that herald sharp reversals.
And that is precisely what we saw last week with the shares shooting up to the $135 area in wave c. But that is exactly where solid chart resistance lies. And I detect a likely small five-up in wave c that may be complete at Friday's high.
The bottom line is that the shares are currently at a crossroads with a likely near-term decline ahead that could lead to a re-test of the wave-b low at $106. Only a push above the $150 level would cancel out this bearish scenario, which I consider less likely.
John Burford is the author of the definitive text on his trading method, Tramline Trading. He is also a freelance contributor and not a direct employee of interactive investor.
These articles are provided for information purposes only. Occasionally, an opinion about whether to buy or sell a specific investment may be provided by third parties. The content is not intended to be a personal recommendation to buy or sell any financial instrument or product, or to adopt any investment strategy as it is not provided based on an assessment of your investing knowledge and experience, your financial situation or your investment objectives. The value of your investments, and the income derived from them, may go down as well as up. You may not get back all the money that you invest. The investments referred to in this article may not be suitable for all investors, and if in doubt, an investor should seek advice from a qualified investment adviser.
Full performance can be found on the company or index summary page on the interactive investor website. Simply click on the company's or index name highlighted in the article.
Disclosure
We use a combination of fundamental and technical analysis in forming our view as to the valuation and prospects of an investment. Where relevant we have set out those particular matters we think are important in the above article, but further detail can be found here.
Please note that our article on this investment should not be considered to be a regular publication.
Details of all recommendations issued by ii during the previous 12-month period can be found here.
ii adheres to a strict code of conduct. Contributors may hold shares or have other interests in companies included in these portfolios, which could create a conflict of interests. Contributors intending to write about any financial instruments in which they have an interest are required to disclose such interest to ii and in the article itself. ii will at all times consider whether such interest impairs the objectivity of the recommendation.
In addition, individuals involved in the production of investment articles are subject to a personal account dealing restriction, which prevents them from placing a transaction in the specified instrument(s) for a period before and for five working days after such publication. This is to avoid personal interests conflicting with the interests of the recipients of those investment articles.