Chart of the week: Apple gets squashed, but is it now a buy?
7th January 2019 11:13
by John Burford from interactive investor
After a spectacular 35% plunge since October, Apple shares look cheap. Technical analyst John Burford reveals what his charts tell us about likely direction.

With last week's 'shock' profit warning, the mainstream media headlines were full of gloom and doom. They emphasised that following the results, 'the shares lost 10%’' (or some variation). That was the big event, apparently.
But in typical mainstream media fashion (who always come late to the party), they perhaps failed to notice that the shares were already in free-fall well before the results! In fact, they made their all-time high back on 3 October at the $234 level. And just before the results, they had sunk to the $155 area for a stunning collapse of $80 or 35%.
The further 10% decline was the icing on the bear cake. So, does that set up a 'Sell the Rumour, Buy the News' event?
Since that collapse had occurred in only three months, where were the media pundits then as the shares sunk below the conventional definition of a bear market of a 20% decline off the high? Surely, that should have stirred up some doom and gloom comments?
But no – and the simple reason for their absence is that bullish sentiment towards the company remained extremely high. Apple investors are known for their dogged devotion not only to the products, but to the company and the shares.
I'm sure many cannot conceive of the notion that the company could possibly follow the example of Nokia who famously was king of the mobile phone heap at one time, only to cascade rapidly down it as – ironically - Apple was rising from the ashes under Steve Jobs to create the behemoth it is today.
As it happened, I became bearish around the time of the early October high as I had counted a complete five waves on extreme bullish sentiment up and the most likely big move then was down.
But now with the media uber-bearish, is it time to get back in now after the shares have suffered a virtual straight-line collapse of such magnitude? Let's look at the chart.
Source: interactive investor Past performance is not a guide to future performance
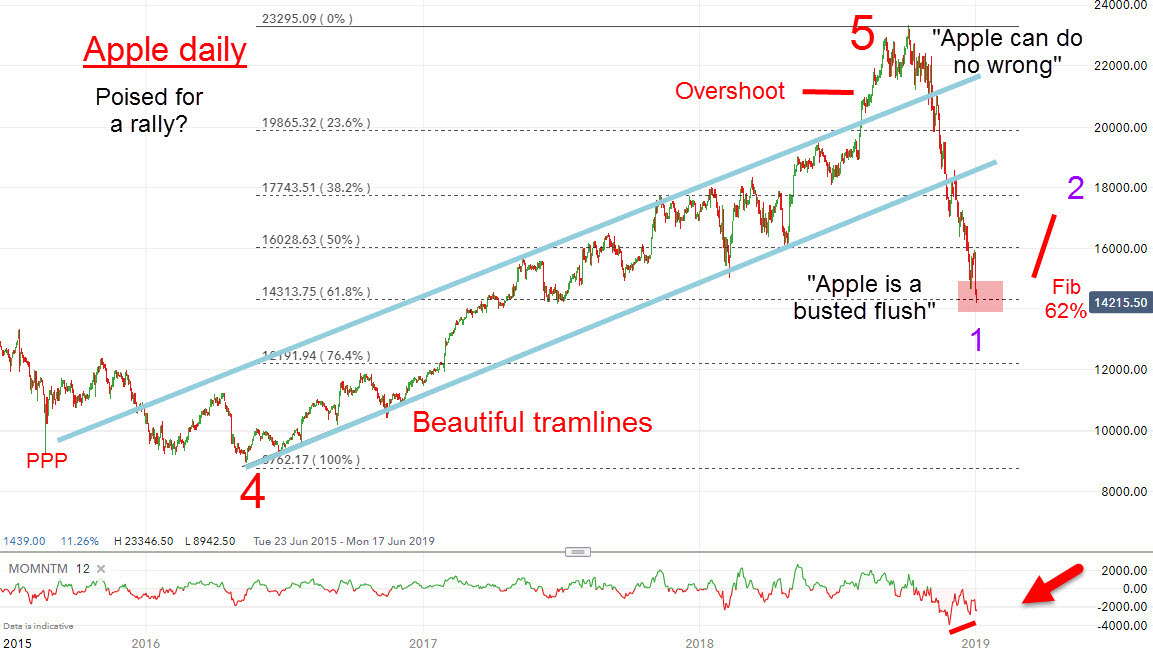
This chart shows the final fifth wave rally from the wave 4 low in May 2016. The rally travelled along the channel contained by my blue tramlines that have multiple accurate touch points and a prior pivot point (PPP), thereby making them highly reliable lines of support/resistance.
But in August, the shares shot above the upper tramline as results came in better than expected. But it was then that I suspected this was a 'buying climax' or 'overshoot' and I started to look for a sell signal, which I located at the $225 level. From the 3 October high, the market started a decline that took it back into the trading channel – and that was my confirmation the bear phase had indeed started.
My first target was the lower tramline (reached in textbook fashion rapidly in November) and didn't stop there. It has now dropped to the Fibonacci 62% retrace of the entire fifth wave up at the $142 area. And note the momentum divergence.
This is an ideal setup for a sharp rebound – and that is my expectation.
Covering shorts and even going long seems prudent, but I do not expect the rally to last long. The new main trend is down. The maximum upside would be a kiss on lower tramline in the $187 area, but I doubt that can be achieved. But there should be a scalp trade to at least $170-$175.
For more information about Tramline Traders, or to take a three-week free trial, go to www.tramlinetraders.com.
John Burford is the author of the definitive text on his trading method, Tramline Trading. He is also a freelance contributor and not a direct employee of interactive investor.
These articles are provided for information purposes only. Occasionally, an opinion about whether to buy or sell a specific investment may be provided by third parties. The content is not intended to be a personal recommendation to buy or sell any financial instrument or product, or to adopt any investment strategy as it is not provided based on an assessment of your investing knowledge and experience, your financial situation or your investment objectives. The value of your investments, and the income derived from them, may go down as well as up. You may not get back all the money that you invest. The investments referred to in this article may not be suitable for all investors, and if in doubt, an investor should seek advice from a qualified investment adviser.
Full performance can be found on the company or index summary page on the interactive investor website. Simply click on the company's or index name highlighted in the article.
Disclosure
We use a combination of fundamental and technical analysis in forming our view as to the valuation and prospects of an investment. Where relevant we have set out those particular matters we think are important in the above article, but further detail can be found here.
Please note that our article on this investment should not be considered to be a regular publication.
Details of all recommendations issued by ii during the previous 12-month period can be found here.
ii adheres to a strict code of conduct. Contributors may hold shares or have other interests in companies included in these portfolios, which could create a conflict of interests. Contributors intending to write about any financial instruments in which they have an interest are required to disclose such interest to ii and in the article itself. ii will at all times consider whether such interest impairs the objectivity of the recommendation.
In addition, individuals involved in the production of investment articles are subject to a personal account dealing restriction, which prevents them from placing a transaction in the specified instrument(s) for a period before and for five working days after such publication. This is to avoid personal interests conflicting with the interests of the recipients of those investment articles.