Chart of the week: A stock poised to thrust higher
Its chart is similar to bitcoin's, but this a textbook pattern with the trend now firmly up.
24th June 2019 13:16
by John Burford from interactive investor
Its chart is similar to bitcoin's, but this a textbook pattern with the trend now firmly up.

Is Tilray going for a high?
Tilray (NASDAQ:TLRY) is a major legal marijuana producer and supplier that is part of the first wave of the so-called 'pot stocks'. These companies have rapidly become a big force in the market and at least one trading platform offers a Cannabis Index comprising a basket of pot stocks.
At first, I simply watched the markets for these shares as they resembled typical aspects of a bubble. I wanted to see how they reacted to the first signs of trouble in their industry before making any move. If major hurdles appeared, such as the blanket refusal of governments to legalise the industry, then bulls may have had to wait a long time for the political climate to change.
But in fact, it appears authorities are now falling over themselves to submit to public pressure to legalise the crop, especially for medical applications. And that means opportunity.
Tilray has suffered of late from a host of problems, but now I believe is poised to advance from recent lows.
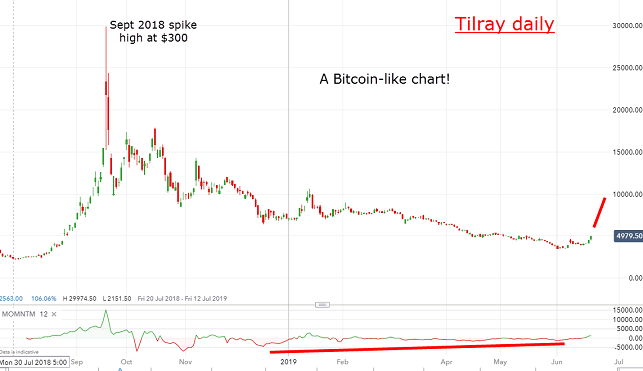
Here is the daily chart showing the spike high to the September top at $300:
Source: interactive investor Past performance is not a guide to future performance
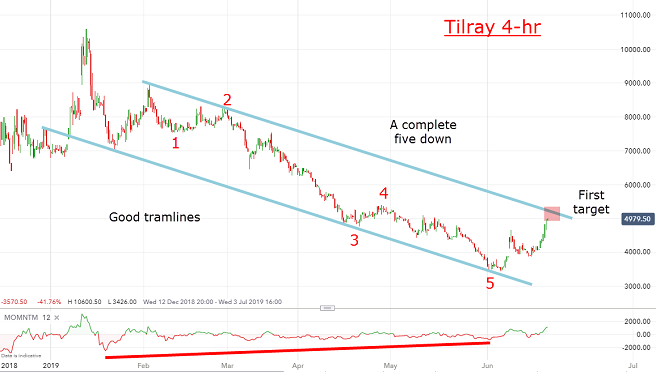
The exponential surge post-IPO to that $300 high marks it as an unsustainable bubble – and the 21-month correction to the recent $35 low was the pay-back for the bulls' over-exuberance. And 21 months is a very long time to wait for a sign of a recovery. But I feel we have one now. Here is the 4-hour chart of recent action:
Source: interactive investor Past performance is not a guide to future performance
I have a textbook lower tramline marking accurate hits on the lows, a five-wave pattern down to the final fifth wave on a momentum divergence. Loyal readers may recognise this set-up as identical to that in British American Tobacco in my COTW of January 28.
From the $35 low, it has rallied to my upper parallel trendline at $50. The move appears to be impulsive, which means the trend is now up, and a clear thrust above the upper line would likely send it towards my first target around the $65 - $70 zone.
I believe the $35 low will hold on any set-back. And will the old high of $300 be seen again? Now, that would be a high!
For more information about Tramline Traders, or to take a three-week free trial, go to www.tramlinetraders.com.
John Burford is the author of the definitive text on his trading method, Tramline Trading. He is also a freelance contributor and not a direct employee of interactive investor.
These articles are provided for information purposes only. Occasionally, an opinion about whether to buy or sell a specific investment may be provided by third parties. The content is not intended to be a personal recommendation to buy or sell any financial instrument or product, or to adopt any investment strategy as it is not provided based on an assessment of your investing knowledge and experience, your financial situation or your investment objectives. The value of your investments, and the income derived from them, may go down as well as up. You may not get back all the money that you invest. The investments referred to in this article may not be suitable for all investors, and if in doubt, an investor should seek advice from a qualified investment adviser.
Full performance can be found on the company or index summary page on the interactive investor website. Simply click on the company's or index name highlighted in the article.
Disclosure
We use a combination of fundamental and technical analysis in forming our view as to the valuation and prospects of an investment. Where relevant we have set out those particular matters we think are important in the above article, but further detail can be found here.
Please note that our article on this investment should not be considered to be a regular publication.
Details of all recommendations issued by ii during the previous 12-month period can be found here.
ii adheres to a strict code of conduct. Contributors may hold shares or have other interests in companies included in these portfolios, which could create a conflict of interests. Contributors intending to write about any financial instruments in which they have an interest are required to disclose such interest to ii and in the article itself. ii will at all times consider whether such interest impairs the objectivity of the recommendation.
In addition, individuals involved in the production of investment articles are subject to a personal account dealing restriction, which prevents them from placing a transaction in the specified instrument(s) for a period before and for five working days after such publication. This is to avoid personal interests conflicting with the interests of the recipients of those investment articles.