Chart of the week: The very best waves to trade
Performance has been sensational, but our analyst believes time is up for the world's biggest retailer.
20th May 2019 11:38
by John Burford from interactive investor
Its performance has been sensational, but our analyst believes time could be up for the world's biggest retailer.

Is the recent Amazon recovery for real?
I have been tracking this hugely popular share for some time, especially since September last year when Amazon (NASDAQ:AMZN) made its all-time-high at the $2,040 level. And it was one of the select few shares that were driving the Nasdaq index into stratospheric levels as a member of the FAANG Gang.
In short, I was expecting a major high in this index based on my reading of the wave patterns and the extreme bullish sentiment prevailing.
Not only that, but a record number (over 80%) of US IPOs were loss-making last year and were coming to market being greeted with rapture by investors. Their love of multi-billion losses knew no bounds.
Of course, I knew this couldn't last. Incidentally, I believe the recent major loss-making Lyft (NASDAQ:LYFT) and Uber (NYSE:UBER) IPO failures were nails in the coffin for the bull market.
But one thing is for certain - investors will lose their appetite for big losses; it's a question of when.
But back in September, Amazon was all the rage, except that it peaked and started a major correction in a clear demonstration that when everything appears terrific for a company, that’s when tops tend to occur.
Here is the long-term weekly chart:
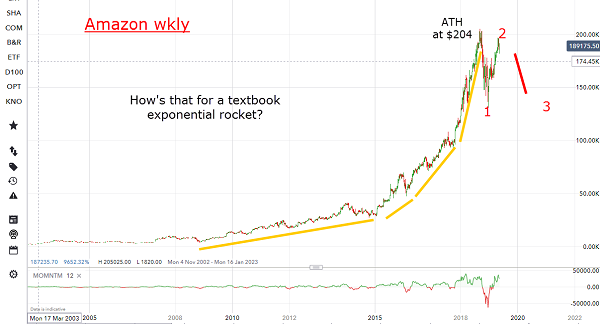
Source: interactive investor Past performance is not a guide to future performance
In fact, the ride has been exponential, with rapidly increasing slopes a la bitcoin. And exponential rallies never end with a whimper – they tend to suffer breath-taking collapses. And the correction after September certainly qualifies as one of these as the shares dropped to the $1,300 level for a loss of 36% off the high.
For the share of a company that devours all in its path, that large magnitude loss must have been a wake-up call to complacent investors who believed tech shares can only go up, especially all-conquering Amazon. They're unstoppable, right?
But since then, the recovery has been swift, and this is the period I wanted to focus on as I was looking out for signs of a top to this recovery. If a top is in this current area, it would likely be a second wave. And all second waves lead to third waves in the opposite direction – and these are the very best waves to trade (they are long and strong).
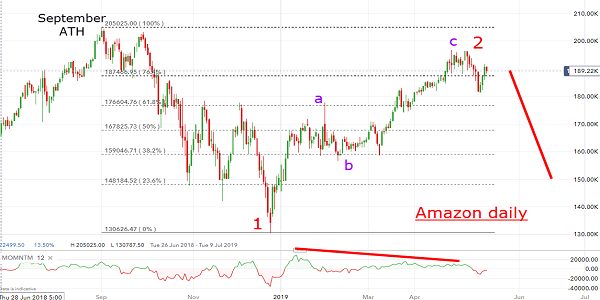
Source: interactive investor Past performance is not a guide to future performance
This pattern remains valid so long as no new all-time high is registered (above $2,050). The large momentum divergence points to a swift decline.
My first major target is the $1,600 region.
The bottom line is that I expect the shares to decline (currently $1,870) but a move above the $1,950 level would temporarily suspend this outlook.
For more information about Tramline Traders, or to take a three-week free trial, go to www.tramlinetraders.com.
John Burford is the author of the definitive text on his trading method, Tramline Trading. He is also a freelance contributor and not a direct employee of interactive investor.
These articles are provided for information purposes only. Occasionally, an opinion about whether to buy or sell a specific investment may be provided by third parties. The content is not intended to be a personal recommendation to buy or sell any financial instrument or product, or to adopt any investment strategy as it is not provided based on an assessment of your investing knowledge and experience, your financial situation or your investment objectives. The value of your investments, and the income derived from them, may go down as well as up. You may not get back all the money that you invest. The investments referred to in this article may not be suitable for all investors, and if in doubt, an investor should seek advice from a qualified investment adviser.
Full performance can be found on the company or index summary page on the interactive investor website. Simply click on the company's or index name highlighted in the article.
Disclosure
We use a combination of fundamental and technical analysis in forming our view as to the valuation and prospects of an investment. Where relevant we have set out those particular matters we think are important in the above article, but further detail can be found here.
Please note that our article on this investment should not be considered to be a regular publication.
Details of all recommendations issued by ii during the previous 12-month period can be found here.
ii adheres to a strict code of conduct. Contributors may hold shares or have other interests in companies included in these portfolios, which could create a conflict of interests. Contributors intending to write about any financial instruments in which they have an interest are required to disclose such interest to ii and in the article itself. ii will at all times consider whether such interest impairs the objectivity of the recommendation.
In addition, individuals involved in the production of investment articles are subject to a personal account dealing restriction, which prevents them from placing a transaction in the specified instrument(s) for a period before and for five working days after such publication. This is to avoid personal interests conflicting with the interests of the recipients of those investment articles.