Chart of the week: Are buyers in control at Sirius Minerals?
Struggling after last August's peak, our chartist has spotted a low-risk chance to trade Sirius shares.
18th March 2019 11:42
by John Burford from interactive investor
Roughed up after hitting a two-year peak last August, our technical analyst has spotted a low-risk opportunity to trade Sirius shares now.

Is Sirius Minerals really a dog of a share?
Sirius Minerals (LSE:SXX) is a well-named mining company as it has been living up to its astronomical name recently – Sirius is the Dog Star. It has certainly been performing like a dog of the London Stock Exchange since the shares have halved from the August 40p high to the current 20p. But is this dog about to leap up?
As Mark Twain famously defined a mine: a hole in the ground with a liar at the top. But that may be too strong for this company as it has proven reserves of the right kind of potash (fertilizer).
However, in common with every mining development in the UK, getting it out of the ground has faced huge practical and regulatory hurdles.
And those pressures have been weighing on the share price in recent months, with funding concerns for completion of the mine adding to worries.
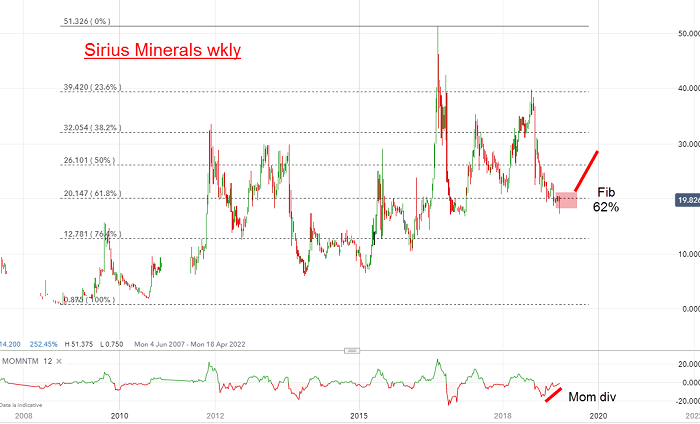
But with the shares now half of their value, and short interest running at 7%, has the 'bad news' been fully discounted? Time to examine the charts – here is the long term weekly:
Source: interactive investor Past performance is not a guide to future performance
The all-time high was made in 2016 at the 52p level as bullish fervour ran rampant. But, as can be seen from the chart, this is no 'buy-and-hold' share. At 20p, it is trading at the same level as in 2011 - a full eight years ago. Unless holding a small stake, can anyone say they would be prepared to do that for that length of time?
However, there may be light at the end of the tunnel as I believe a rally phase approaches.
We have a strong momentum divergence at this low, which is a Fibonacci 62% retracement of the entire rally, which is the most common retracement percentage. This is where many counter-trend moves begin, so will that occur here?
Source: interactive investor Past performance is not a guide to future performance
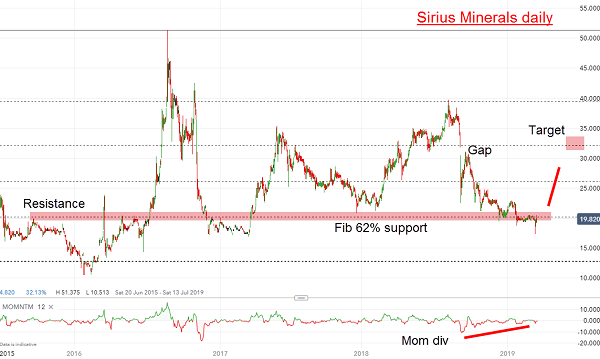
This is the daily chart showing the impressive Fib 62% support and resistance zones and, on this scale, the momentum divergence shows up clearly.
Buyers taking control
Remember, a momentum divergence is showing that the selling pressure is drying up as buyers start to take control.
I believe a buy here represents a low-risk opportunity, and my target is the 30-35p area which would close the September gap. There may be higher potential, depending on developments later this year.
John Burford is the author of the definitive text on his trading method, Tramline Trading. He is also a freelance contributor and not a direct employee of interactive investor.
These articles are provided for information purposes only. Occasionally, an opinion about whether to buy or sell a specific investment may be provided by third parties. The content is not intended to be a personal recommendation to buy or sell any financial instrument or product, or to adopt any investment strategy as it is not provided based on an assessment of your investing knowledge and experience, your financial situation or your investment objectives. The value of your investments, and the income derived from them, may go down as well as up. You may not get back all the money that you invest. The investments referred to in this article may not be suitable for all investors, and if in doubt, an investor should seek advice from a qualified investment adviser.
Full performance can be found on the company or index summary page on the interactive investor website. Simply click on the company's or index name highlighted in the article.
Disclosure
We use a combination of fundamental and technical analysis in forming our view as to the valuation and prospects of an investment. Where relevant we have set out those particular matters we think are important in the above article, but further detail can be found here.
Please note that our article on this investment should not be considered to be a regular publication.
Details of all recommendations issued by ii during the previous 12-month period can be found here.
ii adheres to a strict code of conduct. Contributors may hold shares or have other interests in companies included in these portfolios, which could create a conflict of interests. Contributors intending to write about any financial instruments in which they have an interest are required to disclose such interest to ii and in the article itself. ii will at all times consider whether such interest impairs the objectivity of the recommendation.
In addition, individuals involved in the production of investment articles are subject to a personal account dealing restriction, which prevents them from placing a transaction in the specified instrument(s) for a period before and for five working days after such publication. This is to avoid personal interests conflicting with the interests of the recipients of those investment articles.