Chart of the week: Time to sell this FTSE 100 housebuilder?
Called 'one of the greatest investment opportunities of the century', we analyse this blue-chip's future.
7th May 2019 11:08
by John Burford from interactive investor
Called 'one of the greatest investment opportunities of the century', we analyse this blue-chip's future.

The 2007/2008 Credit Crunch was certainly savagely brutal with a decline from the 406p high to the amazing 3p low, which must rank as one of the greatest investment opportunities of the decade (if not century!). Panic selling was the order of the day.
The rally has been stunning alright, but now the recent 190p high has hit the Fibonacci 76% retrace and on a growing momentum divergence. Also note the most recent action has been contained inside my small-scale blue tramlines. This pattern often appears at the end of a trend. Any break below it would likely send the shares lower.
But, if it catches a bid soon, it could rally to test the 200p resistance area again. Although possible, I set the odds of a sharp move above this zone very low. It appears the path of least resistance is now down.
Is Taylor Wimpey a sell?
This major housebuilder is attracting much attention in the mainstream media with headlines such as: Is Taylor Wimpey's (LSE:TW.) share price the biggest bargain in the FTSE 100? And Should we be buying into Taylor Wimpey's 5.6% dividend yield?
Yes, in a low (and negative) interest rate world, a 5.6% yield appears a no-brainer, especially given the seller's market for homes. And that attraction has helped the share price rally from the Christmas low of 130p to the recent high at the 190p area – a stunning near-50% advance.
Always in these situations after a sharp price run-up, I ask the basic question: Is the bumper yield in any danger in the months/years ahead? And has the dividend value been accounted for in the post-Christmas surge? In other words, what further 'bullish' developments can keep the share price aloft?
One of the main drivers of this share is the state - and prospects - of the construction and housing market. In the 2007/2008 credit debacle, the first in the line of fire were the housebuilders as they are super-sensitive to changing credit conditions. In fact, the real estate sector led the whole US market down in 2007 and will likely do the same in the next downturn.
To my eyes, we are seeing a major turn in the UK housing market. Sales volumes are dropping sharply and, finally, the year-on-year average house price is also in decline. Also, negative comments of the shoddy build quality of the majors are emerging from the authorities as more major fault scandals are revealed.
The list of negatives goes on – with the builders engaging in disreputable gauging behaviour of many of their leasehold contracts (that they sell on to investors). Finally, the markets that lead the way at the top end – London, Toronto, Vancouver, San Francisco – are rapidly coming off the boil.
With signs of strong headwinds, what do the charts indicate? Here is the long-term weekly:
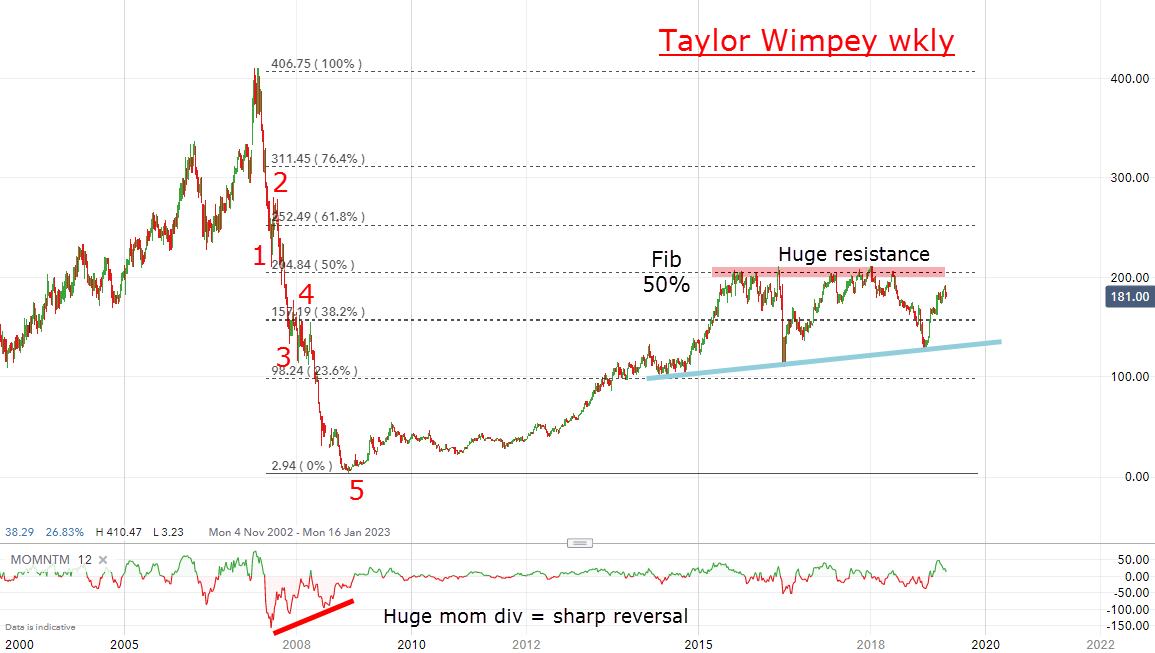
Source: interactive investor Past performance is not a guide to future performance
The 2007/2008 Credit Crunch was certainly savagely brutal with a decline from the 406p high to the amazing 3p low, which must rank as one of the greatest investment opportunities of the decade (if not century!). Panic selling was the order of the day.
But note the decline was in a clear 'five wave' pattern with a huge momentum divergence at the 3p low. And those two features were all the evidence an investor needed to forecast a sharp recovery – and fill his/her boots. It took some time, but in 2012 the shares started picking up smartly and reached the Fibonacci 50% resistance level at 200p in 2015.
And it has not exceeded that level for four years, despite the hugely bullish UK property market. The 200p zone therefore represents very stiff resistance. Let's take a look at the recent action:
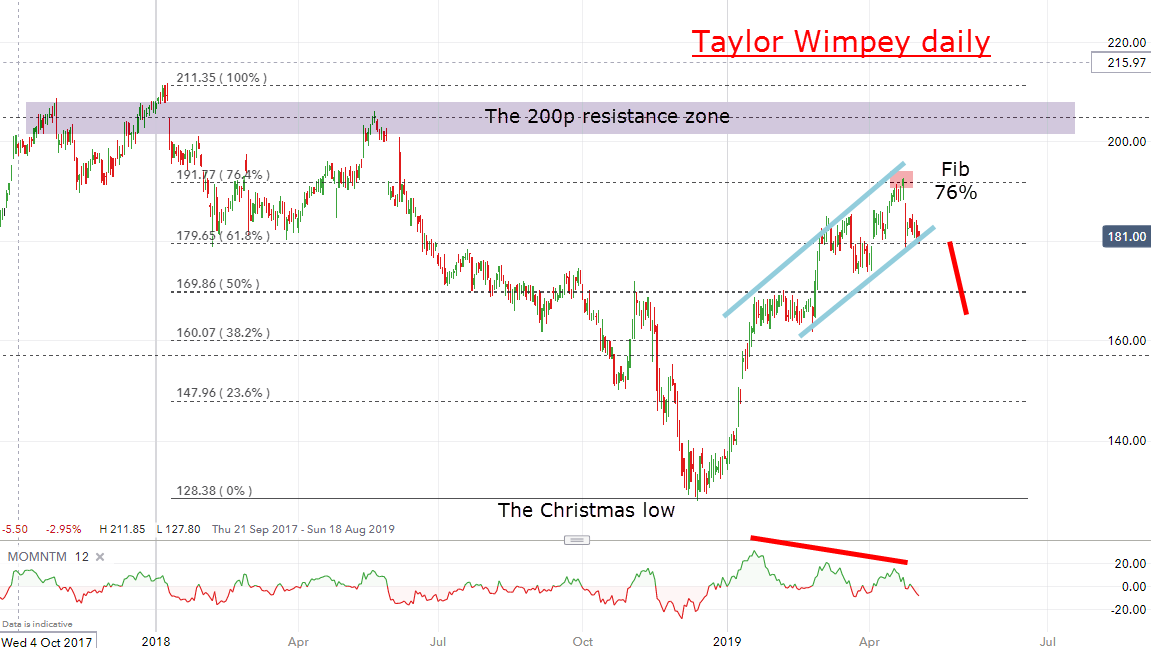
Source: interactive investor Past performance is not a guide to future performance
The rally has been stunning alright, but now the recent 190p high has hit the Fibonacci 76% retrace and on a growing momentum divergence. Also note the most recent action has been contained inside my small-scale blue tramlines. This pattern often appears at the end of a trend. Any break below it would likely send the shares lower.
But, if it catches a bid soon, it could rally to test the 200p resistance area again. Although possible, I set the odds of a sharp move above this zone very low. It appears the path of least resistance is now down.
For more information about Tramline Traders, or to take a three-week free trial, go to www.tramlinetraders.com.
John Burford is the author of the definitive text on his trading method, Tramline Trading. He is also a freelance contributor and not a direct employee of interactive investor.
These articles are provided for information purposes only. Occasionally, an opinion about whether to buy or sell a specific investment may be provided by third parties. The content is not intended to be a personal recommendation to buy or sell any financial instrument or product, or to adopt any investment strategy as it is not provided based on an assessment of your investing knowledge and experience, your financial situation or your investment objectives. The value of your investments, and the income derived from them, may go down as well as up. You may not get back all the money that you invest. The investments referred to in this article may not be suitable for all investors, and if in doubt, an investor should seek advice from a qualified investment adviser.
Full performance can be found on the company or index summary page on the interactive investor website. Simply click on the company's or index name highlighted in the article.
Disclosure
We use a combination of fundamental and technical analysis in forming our view as to the valuation and prospects of an investment. Where relevant we have set out those particular matters we think are important in the above article, but further detail can be found here.
Please note that our article on this investment should not be considered to be a regular publication.
Details of all recommendations issued by ii during the previous 12-month period can be found here.
ii adheres to a strict code of conduct. Contributors may hold shares or have other interests in companies included in these portfolios, which could create a conflict of interests. Contributors intending to write about any financial instruments in which they have an interest are required to disclose such interest to ii and in the article itself. ii will at all times consider whether such interest impairs the objectivity of the recommendation.
In addition, individuals involved in the production of investment articles are subject to a personal account dealing restriction, which prevents them from placing a transaction in the specified instrument(s) for a period before and for five working days after such publication. This is to avoid personal interests conflicting with the interests of the recipients of those investment articles.