Chart of the week: Can M&S shares rise from the dead?
Less-than-disastrous results this week have potential to trigger a short squeeze, argues our chartist.
4th November 2019 10:05
by John Burford from interactive investor
Less-than-disastrous results this week have potential to trigger a short squeeze, argues our chartist.
Could it be? Is it possible? After holding to a firmly bearish stance on this share for many many months – and taking excellent profits on my shorts - do I see light at the end of this long bearish tunnel for the battered Marks & Spencer (LSE:MKS) shares?
If my contrarian antennae that are twitching in a St Vitus Dance are correct, we should be on the verge of a very decent rally phase that would confound the massed army of retail sector shorts. A short squeeze here would surely send them running for cover.
So why am I adding it to my growing Buy Low/Sell High list? For one thing, I like the super bearish sentiment of the market towards not just this share but much of High Street retail. We should all know by now that major lows are always and everywhere put in when sentiment is very bearish. That is what many traders/investors seem to miss. They can't help buying high and selling low.
It is well said that markets exist to punish the majority.
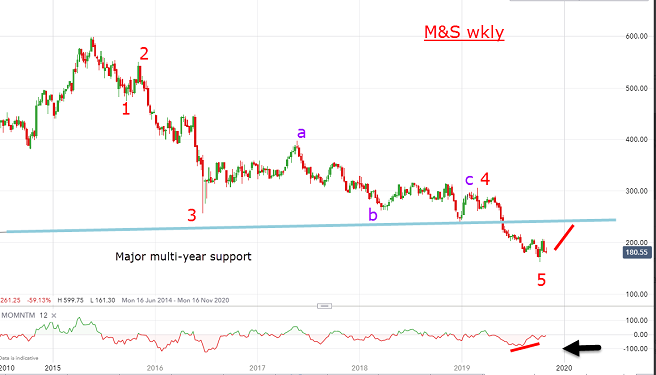
Second, I like the chart patterns that are highly conducive to a reversal. Here is the long-term weekly chart:
Source: interactive investor Past performance is not a guide to future performance
I have a decent impulsive five waves down off the May 2015 £5.95 high to the recent £1.62 low set on October 10th. Since then, the market has rallied and is now in a small correction to that surge. But note the low was made on a strong momentum divergence – a signal the selling pressure is waning.
The blue line is a multi-year line of support/resistance, so that any push up to it (around the £2.40 area) could result in a further advance to take it above the line – and then we would have a bullish 'overshoot' of that line. An 'overshoot' is a true selling climax – and a precursor of further bullish action to come.
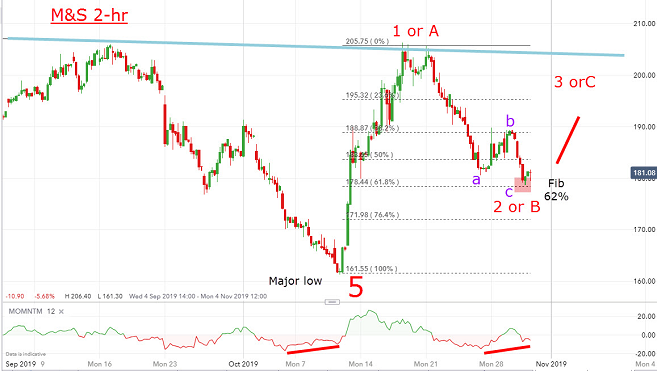
Here is a close-up of recent action:
Source: interactive investor Past performance is not a guide to future performance
The chart above shows the recent dip has carried to the classic Fibonacci 62% retrace on a momentum divergence. Odds are high that the reversal is nigh, and my first target is the £2.50 region. Of course, any re-structuring/takeover developments would very likely send the shares above this level.
Interim results are due this week and sentiment is already negative. Any less-than-disastrous numbers may well induce support.
The bottom line: I am warming to M&S as a trade and/or investment. Only a drop below the wave 5 low at £1.62 would send me back to the drawing board.
For more information about Tramline Traders, or to take a three-week free trial, go to www.tramlinetraders.com.
John Burford is the author of the definitive text on his trading method, Tramline Trading. He is also a freelance contributor and not a direct employee of interactive investor.
These articles are provided for information purposes only. Occasionally, an opinion about whether to buy or sell a specific investment may be provided by third parties. The content is not intended to be a personal recommendation to buy or sell any financial instrument or product, or to adopt any investment strategy as it is not provided based on an assessment of your investing knowledge and experience, your financial situation or your investment objectives. The value of your investments, and the income derived from them, may go down as well as up. You may not get back all the money that you invest. The investments referred to in this article may not be suitable for all investors, and if in doubt, an investor should seek advice from a qualified investment adviser.
Full performance can be found on the company or index summary page on the interactive investor website. Simply click on the company's or index name highlighted in the article.
Disclosure
We use a combination of fundamental and technical analysis in forming our view as to the valuation and prospects of an investment. Where relevant we have set out those particular matters we think are important in the above article, but further detail can be found here.
Please note that our article on this investment should not be considered to be a regular publication.
Details of all recommendations issued by ii during the previous 12-month period can be found here.
ii adheres to a strict code of conduct. Contributors may hold shares or have other interests in companies included in these portfolios, which could create a conflict of interests. Contributors intending to write about any financial instruments in which they have an interest are required to disclose such interest to ii and in the article itself. ii will at all times consider whether such interest impairs the objectivity of the recommendation.
In addition, individuals involved in the production of investment articles are subject to a personal account dealing restriction, which prevents them from placing a transaction in the specified instrument(s) for a period before and for five working days after such publication. This is to avoid personal interests conflicting with the interests of the recipients of those investment articles.