Chart of the week: a cyclical sector to outperform technology
16th May 2022 15:10
by John Burford from interactive investor
This 100-year-old company is tipped to race towards record territory as analyst John Burford spots a textbook set-up for a contrarian bull trade.

The Ford Motor Company started it – can it lead it back?
Today, investors have a mighty dilemma. Many influential voices are forecasting a recession just down the road (UK GDP is already in decline). And no wonder. With the cost-of-living crisis seemingly worsening, energy prices apparently shooting for the Moon, commodity prices exploding upwards and, to cap it all, interest rates are moving sharply up off the near-zero bounds of the last few years.
With this macro background, forecasts of a crash in the housing markets are common, but still house prices and rents are moving up. Yet many pundits are forecasting a severe slowdown in house-buying activity later this year. We shall see.
That is a pretty long list of negatives for an investor looking to buy shares for the medium to long pull! Bullish sentiment is pretty hard to find. Any investor today buying shares is truly a contrarian!
- Recessions are becoming more likely – here’s how to invest
- Warren Buffett: stocks I’m buying and AGM comments
- Want to buy and sell international shares? It’s easy to do. Here’s how
But on the other hand, shares have retreated – by very large margins for some, especially tech – and since buying the dip has been such a successful strategy in the past few years, we must ask if this is such a buyable dip for very cheap shares, especially for US issues?
I believe the tech story is over in this new age of rising interest rates that is putting the squeeze on consumer spending.
But consider the auto industry. It has been clobbered by the parts supply constraints crisis, as well as the escalating sticker prices for electric vehicles as raw material costs for batteries are exploding (pun intended). Used car prices have now shot above new ones in a bizarre twist occasioned by the parts shortage where delivery delays of months for a new vehicle is common.
This is a cyclical sector that I believe will far outperform tech as cars are an essential need (Netflix isn't) and are mostly price insensitive.
Here is Ford Motor Company (NYSE:F) – a reliable old-line company that started the whole era of affordable vehicles just over 100 years ago.
Past performance is not a guide to future performance.
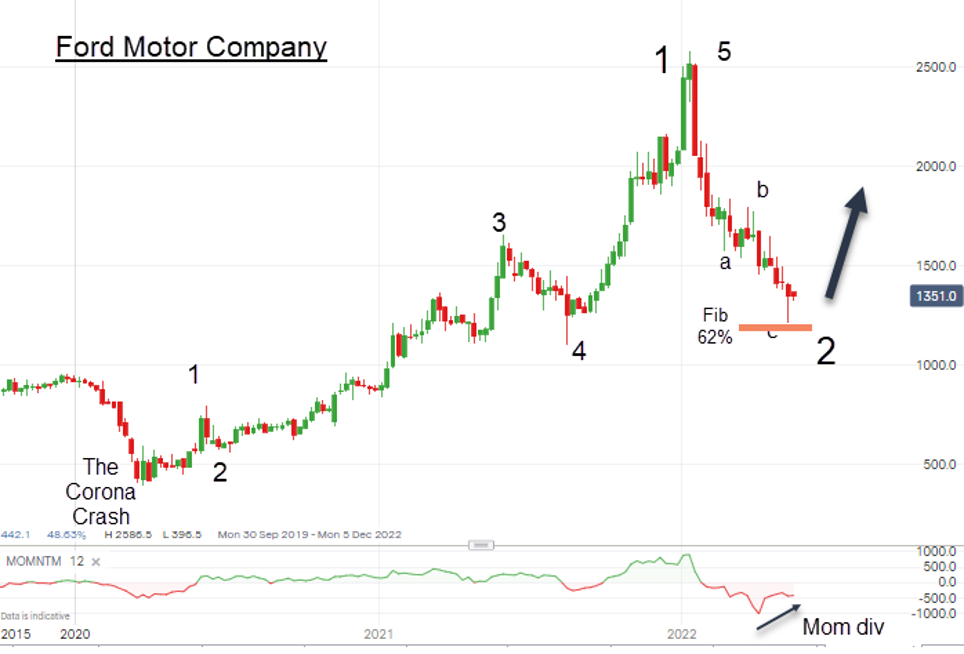
From the depths of the corona crash low a little over two years ago, Ford shares advanced five-fold from around $5 to the January high around $25 and, together with the general market, have dipped to the recent $12 low which is a tidy Fibonacci 62% retrace.
Note the advance traced out a clear five-wave impulsive structure this (indicates main trend remains up) and is correcting in what appears to be a three down. This is one of my textbook set-ups for a contrarian bull trade, especially given the budding momentum (Mom) divergence, which indicates a weakening of selling pressure.
The parts supply issue will be resolved, battery technology is making rapid strides and demand remains high. Ford should capitalise on these trends and the shares should move higher towards the old $25 high and perhaps even above it in due course.
John Burford is a freelance contributor and not a direct employee of interactive investor.
These articles are provided for information purposes only. Occasionally, an opinion about whether to buy or sell a specific investment may be provided by third parties. The content is not intended to be a personal recommendation to buy or sell any financial instrument or product, or to adopt any investment strategy as it is not provided based on an assessment of your investing knowledge and experience, your financial situation or your investment objectives. The value of your investments, and the income derived from them, may go down as well as up. You may not get back all the money that you invest. The investments referred to in this article may not be suitable for all investors, and if in doubt, an investor should seek advice from a qualified investment adviser.
Full performance can be found on the company or index summary page on the interactive investor website. Simply click on the company's or index name highlighted in the article.
Disclosure
We use a combination of fundamental and technical analysis in forming our view as to the valuation and prospects of an investment. Where relevant we have set out those particular matters we think are important in the above article, but further detail can be found here.
Please note that our article on this investment should not be considered to be a regular publication.
Details of all recommendations issued by ii during the previous 12-month period can be found here.
ii adheres to a strict code of conduct. Contributors may hold shares or have other interests in companies included in these portfolios, which could create a conflict of interests. Contributors intending to write about any financial instruments in which they have an interest are required to disclose such interest to ii and in the article itself. ii will at all times consider whether such interest impairs the objectivity of the recommendation.
In addition, individuals involved in the production of investment articles are subject to a personal account dealing restriction, which prevents them from placing a transaction in the specified instrument(s) for a period before and for five working days after such publication. This is to avoid personal interests conflicting with the interests of the recipients of those investment articles.