Chart of the week: are US markets too big to fail?
Either stocks will never fall again or the market is due a correction, says our technical analyst.
24th August 2020 14:51
by John Burford from interactive investor
Either stocks will never fall again or the market is due a correction. Our technical analyst knows which one he’s betting on.

We are in one of the most difficult periods in financial markets that I have experienced. Either it really is different this time, and stocks will never fall again ever, or we are poised for a mammoth correction. I cannot see any other option.
The overwhelming impression is that everything has been going up (except the dollar) as analysts point to actions by the Fed in pumping even larger heaps of dollars into the system than they did in all the quantitative easing operations since 2008.
New record all-time highs are being set by the Nasdaq and S&P (a very recent addition to the list), although not in the Dow (or any of its component sectors). All the while earnings are flat at best. The FTSE is notably lagging and is down 21% in the year to date.
In fact, we have two separate stock markets. One is the narrow collection of big name US tech titans that are in vertical rallies. The other is the rest, and a fragmented market is an unstable one.
The leaders are so dominant that the market cap of just seven stocks equates now to an incredible 40% of US gross domestic product (GDP). And the Fed balance sheet now equals 36% of US GDP. And the market cap of just one – Apple – now equals the entire market cap of the Russell 2000 index – all 200 of them put together (see last week’s Chart of the Week).
Given these huge imbalances, I ask: does it make sense to find “value” in certain shares (such as in the financials) given the potential for a huge correction ahead? To me, the reward/risk outlook is not favourable. One year ago, Tesla traded at $225 (£171.5) – it is now $2,050, a ten-fold increase. Incredible. For comparison, Lloyds traded at 58p one year ago. It now trades at 28p.
Here is the ugly truth displayed in the comparison between KBW (the index of 24 of largest US banks) and the S&P 500:
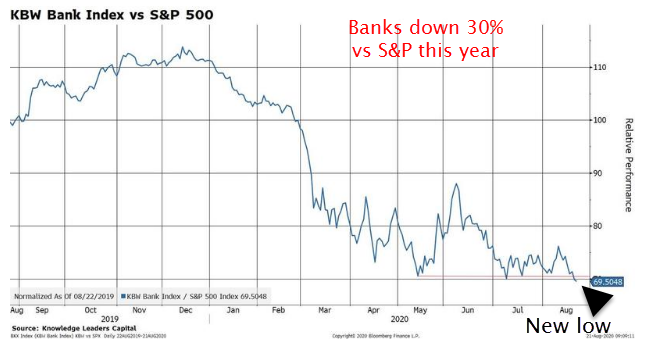
Source: interactive investor. Past performance is not a guide to future performance.
With the Fed trapped into its seemingly perpetual support paradigm (verbally and financially), many are asking: has the US market become too big to fail? Is it just as the “too big to fail” banks were in the 2007-09 credit crunch? If so, the positions of the banks and business (tech) have been completely reversed! And the banks are still here.
Because I have demonstrated time after time that market highs are always attended by high overall bullish conviction (never, ever when bearishness is supreme), odds are best placed on a correction ahead.
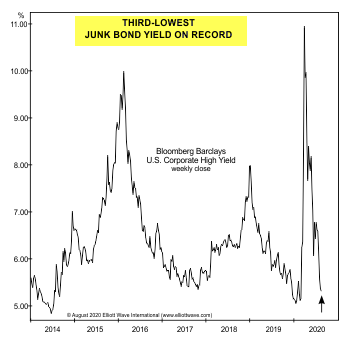
Today, bullish conviction is off the scale. This is a revealing chart of junk bond yields since 2014:
Source: interactive investor. Past performance is not a guide to future performance.
Remember, junk bonds (aka high yield) are issued by the riskiest of companies. With the figure at a little over 5% is at one of the lowest points ever. Note it reached the 11% mark in March during the corona crash. With belief in a V-shaped recovery now widespread, investors are willing to accept this measly yield in the face of a flat pandemic-infused economy. Now that’s what I call irrational exuberance!
Watch out below!
For more information about Tramline Traders, or to take a three-week free trial, go to www.tramlinetraders.com.
John Burford is the author of the definitive text on his trading method, Tramline Trading. He is also a freelance contributor and not a direct employee of interactive investor.
These articles are provided for information purposes only. Occasionally, an opinion about whether to buy or sell a specific investment may be provided by third parties. The content is not intended to be a personal recommendation to buy or sell any financial instrument or product, or to adopt any investment strategy as it is not provided based on an assessment of your investing knowledge and experience, your financial situation or your investment objectives. The value of your investments, and the income derived from them, may go down as well as up. You may not get back all the money that you invest. The investments referred to in this article may not be suitable for all investors, and if in doubt, an investor should seek advice from a qualified investment adviser.
Full performance can be found on the company or index summary page on the interactive investor website. Simply click on the company's or index name highlighted in the article.
Disclosure
We use a combination of fundamental and technical analysis in forming our view as to the valuation and prospects of an investment. Where relevant we have set out those particular matters we think are important in the above article, but further detail can be found here.
Please note that our article on this investment should not be considered to be a regular publication.
Details of all recommendations issued by ii during the previous 12-month period can be found here.
ii adheres to a strict code of conduct. Contributors may hold shares or have other interests in companies included in these portfolios, which could create a conflict of interests. Contributors intending to write about any financial instruments in which they have an interest are required to disclose such interest to ii and in the article itself. ii will at all times consider whether such interest impairs the objectivity of the recommendation.
In addition, individuals involved in the production of investment articles are subject to a personal account dealing restriction, which prevents them from placing a transaction in the specified instrument(s) for a period before and for five working days after such publication. This is to avoid personal interests conflicting with the interests of the recipients of those investment articles.