Chart of the week: can Tui get off the ground as lockdowns ease?
Our chartist asks if the company can regain the status of its glory days.
15th March 2021 12:10
by John Burford from interactive investor
Our chartist asks if the company can regain the status of its glory days.

TUI (LSE:TUI), the major tour, cruise and travel company, performed a belly flop following the coronavirus crash a year ago – a not unexpected event as news of the pandemic spread.
It was already losing altitude off its all-time high, set in May 2018 at the lofty £18 valuation. It hit the ground on 16 March last year at the £2 mark.
But despite generally poor news since then (including Boeing (NYSE:BA)’s woes), the shares have inched up off the ground.
Of course, the big question is this: is this one of my great ‘buy low, sell high’ candidates, or is the company forever doomed not to regain the glory days of free and easy travel existing pre-pandemic?
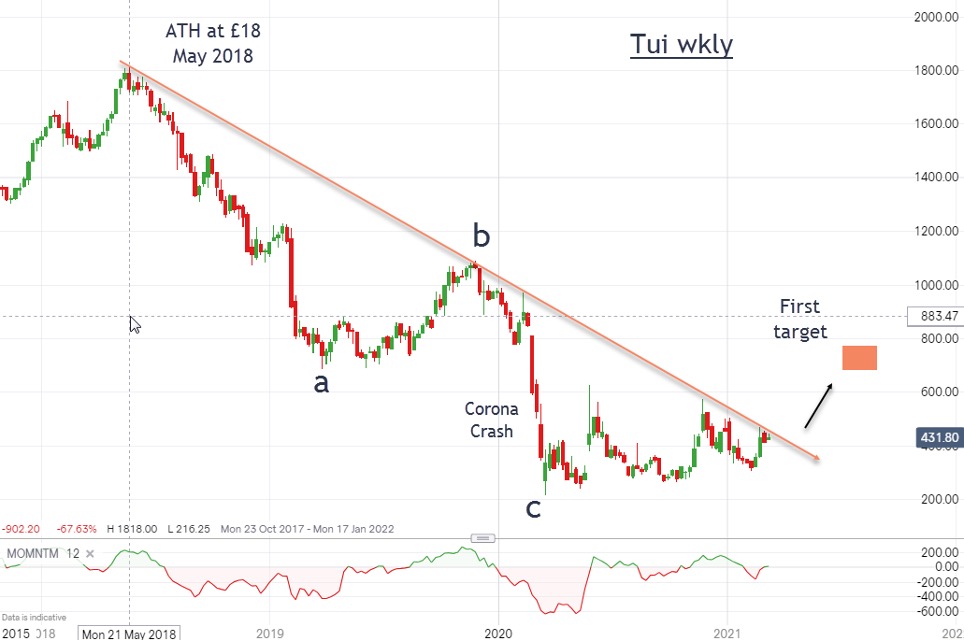
Here is the long-term weekly chart:
Past performance is not a guide to future performance.
The decline off the all-time high is in a clear three-wave pattern, and that supports a bullish view as three waves characterise a corrective phase to the one larger trend.
Note the market has pushed up to meet the major trendline off the all-time high.
Any advance from here above this trendline would be a potentially very bullish signpost with one target around £8.
- Stockopedia: 10 stocks that brokers are backing to grow fast
- ii view: TUI descends into a major loss
- Are you saving enough for retirement? Our calculator can help you find out
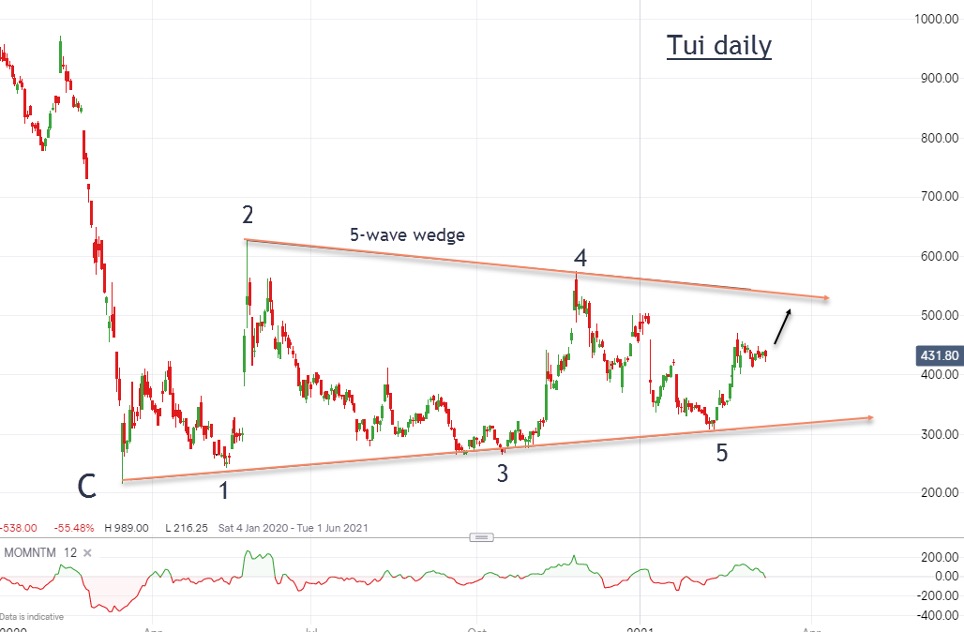
Here is a close-up of recent action showing a lovely five-wave wedge in formation.
The lower trendline has four very accurate hits, and thus can be considered a very reliable line of support to any possible further declines below it.
Past performance is not a guide to future performance.
The general expectation is that global travel restrictions are about to be gradually lifted. So chances are the advance can continue, especially if the resistance at the weekly chart trendline and at the above wedge upper trendline can be overcome.
Note the latest dip to the £3 level mid-February back to the lower wedge line was a very low-risk buy entry for those that were following this share on a daily basis. In general, buying into major support is a high probability tactic with good odds of success.
Of course, from here much will depend on the success of each nation’s vaccine roll-out. This is not a given, even in some ‘advanced’ countries, apparently – but nations that heavily depend on tourism will be straining at the leash to get visitors in as promptly as possible.
I remain bullish (latest £4.30) but any major drop below the £3 print would send me back to the drawing board.
John Burford is the author of the definitive text on his trading method, Tramline Trading. He is also a freelance contributor and not a direct employee of interactive investor.
These articles are provided for information purposes only. Occasionally, an opinion about whether to buy or sell a specific investment may be provided by third parties. The content is not intended to be a personal recommendation to buy or sell any financial instrument or product, or to adopt any investment strategy as it is not provided based on an assessment of your investing knowledge and experience, your financial situation or your investment objectives. The value of your investments, and the income derived from them, may go down as well as up. You may not get back all the money that you invest. The investments referred to in this article may not be suitable for all investors, and if in doubt, an investor should seek advice from a qualified investment adviser.
Full performance can be found on the company or index summary page on the interactive investor website. Simply click on the company's or index name highlighted in the article.
Disclosure
We use a combination of fundamental and technical analysis in forming our view as to the valuation and prospects of an investment. Where relevant we have set out those particular matters we think are important in the above article, but further detail can be found here.
Please note that our article on this investment should not be considered to be a regular publication.
Details of all recommendations issued by ii during the previous 12-month period can be found here.
ii adheres to a strict code of conduct. Contributors may hold shares or have other interests in companies included in these portfolios, which could create a conflict of interests. Contributors intending to write about any financial instruments in which they have an interest are required to disclose such interest to ii and in the article itself. ii will at all times consider whether such interest impairs the objectivity of the recommendation.
In addition, individuals involved in the production of investment articles are subject to a personal account dealing restriction, which prevents them from placing a transaction in the specified instrument(s) for a period before and for five working days after such publication. This is to avoid personal interests conflicting with the interests of the recipients of those investment articles.