Chart of the week: why the FTSE 100 is at a moment of truth
22nd November 2021 11:40
by John Burford from interactive investor
The blue-chip index is at a crucial level – is this the final thrust of the rally, or can the index advance to new highs? Our charts expert shares his analysis.

I am devoting this week's COTW to a review of the FTSE 100 since I believe it has reached a most critical point around the 7,200 level. The direction of travel from here will set the tone for many large-cap UK shares into the new year (only six weeks away!).
Recall the 7,200 level has been my 'line in the sand' for the rally off the March 2020 Corona Crash low (remember that?). The rally off that low has been sparked by the feeling that the global pandemic (that hit many 'real' businesses hard) was under control thanks to the miracle of the vaccines. Business could then get back to 'normality' and markets could see clear blue skies ahead thanks to the never-ending supply of cheap and plentiful 'stimulus' money.
Consumers would then resume their free-spending habits and shares would once again shoot for the Moon. That has been the general assumption, and shares have been responding (especially in the US).
But a funny thing happened on the way to the Moon. Taxes are now slated to rise sharply, and price inflation is rearing its very large head, with the cost of living rising after a lengthy period of stability thanks to stable oil prices, now rising. But is this just another Wall of Worry that shares have previously overcome?
- FTSE for Friday: end-of week targets for the blue-chip index and bitcoin
- Insider: chiefs bet big money on recovery at FTSE 100 and FTSE 250 stocks
With the combination of these factors, and the sudden imposition of lockdowns in a few European nations in response to a renewed Covid outbreak as we head into the more difficult winter period, shares in the travel sector have been hit. Are these the canary in the coal mine for the market as a whole?
With the index poised to move either way off my 7,200 line in the sand, odds are about evenly poised.
But reports of widespread anger and violent demonstrations over the renewed lockdowns in Europe, is a huge warning to investors that social mood is turning negative – and that is the key driver of stock prices.
The FTSE made a new rally high at 7,400 on 12 November and has declined every day since then to the current 7,200 mark (my line on the sand). Thus, it may well be the final thrust of the rally.
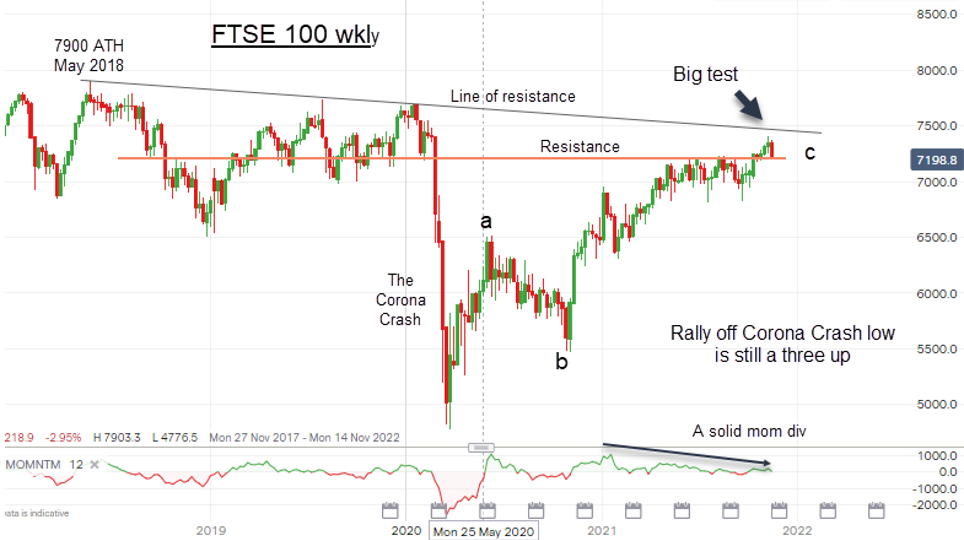
Here is the updated weekly chart:
Past performance is not a guide to future performance
My line of resistance off the 2018 all-time high at 7,900 has three accurate touch points and the market has rallied to be close to that line. The other key feature is the brief push above my pink line in the sand at 7,200 and the pull-back last week to close on it.
Third, the push up to 7,400 was accompanied by a clear momentum divergence, indicating lack of conviction, with buying power weaker than at the January high. And fourth, the rally off the March 2020 low still looks like a three-wave pattern – and these are always corrective to the main trend.
- Read more insights from John Burford here
- Take control of your retirement planning with our award-winning, low-cost Self-Invested Personal Pension (SIPP)
My conclusion? One more strong close below 7,200 this week would put the cap on the entire rally and lead to a move down to test the 6,900 and then the 6,500 levels. If that occurs, the decline should be very strong since it would be a third wave (of a five-wave impulsive sequence).
But if the market could rally above the line of resistance above 7,500 – and stay there - further gains are much more likely. Thus, I have clear two-way options from current levels.
John Burford is the author of the definitive text on his trading method, Tramline Trading. He is also a freelance contributor and not a direct employee of interactive investor.
These articles are provided for information purposes only. Occasionally, an opinion about whether to buy or sell a specific investment may be provided by third parties. The content is not intended to be a personal recommendation to buy or sell any financial instrument or product, or to adopt any investment strategy as it is not provided based on an assessment of your investing knowledge and experience, your financial situation or your investment objectives. The value of your investments, and the income derived from them, may go down as well as up. You may not get back all the money that you invest. The investments referred to in this article may not be suitable for all investors, and if in doubt, an investor should seek advice from a qualified investment adviser.
Full performance can be found on the company or index summary page on the interactive investor website. Simply click on the company's or index name highlighted in the article.
Disclosure
We use a combination of fundamental and technical analysis in forming our view as to the valuation and prospects of an investment. Where relevant we have set out those particular matters we think are important in the above article, but further detail can be found here.
Please note that our article on this investment should not be considered to be a regular publication.
Details of all recommendations issued by ii during the previous 12-month period can be found here.
ii adheres to a strict code of conduct. Contributors may hold shares or have other interests in companies included in these portfolios, which could create a conflict of interests. Contributors intending to write about any financial instruments in which they have an interest are required to disclose such interest to ii and in the article itself. ii will at all times consider whether such interest impairs the objectivity of the recommendation.
In addition, individuals involved in the production of investment articles are subject to a personal account dealing restriction, which prevents them from placing a transaction in the specified instrument(s) for a period before and for five working days after such publication. This is to avoid personal interests conflicting with the interests of the recipients of those investment articles.