Chart of the Week: Will Lloyds ever recover?
13th August 2018 13:11
by John Burford from interactive investor
With Lloyds Banking Group shares continuing to frustrate, technical analyst John Burford has more bad news for beleaguered investors.

Since my last coverage of Lloyds Banking Group on 26 March, the shares have been following my roadmap – down.
And with the downtrend firmly in place, many are wondering when or even if the shares will recover any time soon. So today I will analyse the charts and see if the hopes of the bulls are realistic.
In my Chart of the Week for 26 March, this was the chart I posted:

Source: interactive investor Past performance is not a guide to future performance
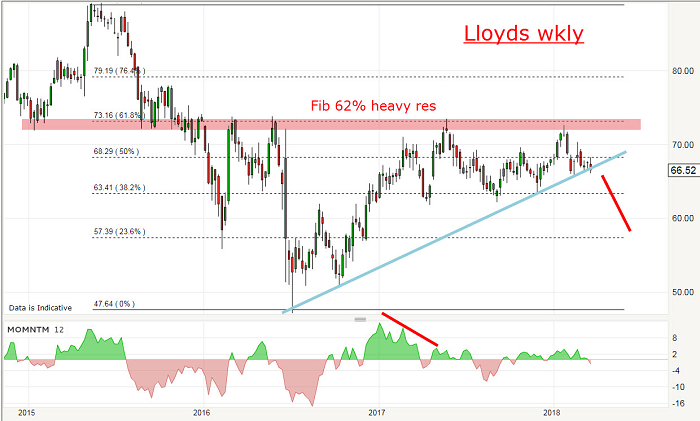
As I pointed out at the time, the pink zone at 72p–73p has been very strong resistance (and support until early 2016). And in late January, the shares tested that zone (again) and were turned back (again).
Interestingly, that was the precise date when the Dow made its all-time high.
That zone is also the Fibonacci 62% retrace of the entire decline – another very strong area of resistance.
The odds for a decline off the January high was strong and I noted that a break of the blue trendline was imminent as the shares were trading around the 66p level.
And this is the recent action off the February high:

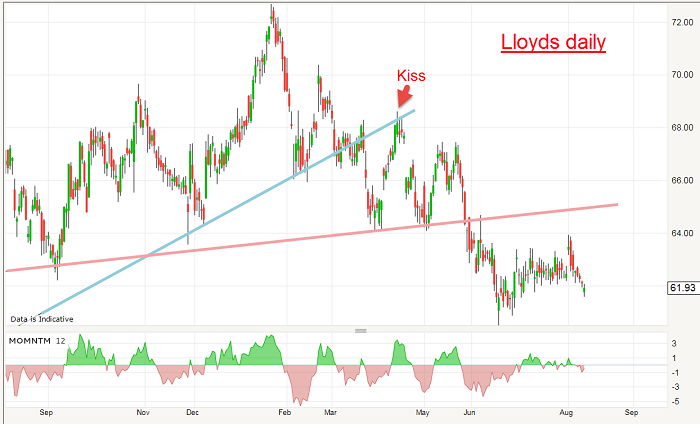
The blue trendline is my original line of support/resistance and the pink line is another internal line of support – and now resistance after the clear break last month.
Note the break of the blue support line in late March and a hard move down and then a rally back to the underside of the line to plant a kiss before peeling away again. I have pointed out before how useful these kisses are.
I like to expect these kisses when a significant trendline is broken as it offers a very low risk trade entry. A short trade taken at the kiss at the 68p level could sensibly be protected by a close stop at 70p with a very high probability of success.
And from then, the market has been declining and according to plan.
And gazing at the charts again, I am unable to see a likely pause in the downtrend until the 57p area is reached. And here is the sad big picture:

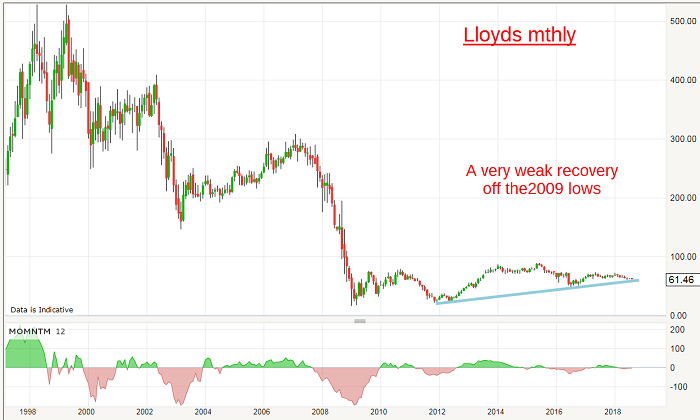
From the giddy heights pre-millennium at the £5 area, the huge and savage bear trend produced a 2009 low at the 17p level for a staggering loss of 97%. Who said banks never go bust? This one almost did.
But the ten-year recovery helped by quantitative easing has been very weak as the rallies have looked like mere blips on this chart.
Is there any prospect for the banking sector to get its mojo back? With public and private debts at stratospheric levels, the housing markets rolling over as interest rates rise, and Brexit uncertainties looming, it is hard to gather much confidence for that.
It appears the shares are vulnerable for a break of my blue trendline in the near future, with my target at around 40p.
John Burford is the author of the definitive text on his trading method, Tramline Trading. He is also a freelance contributor and not a direct employee of interactive investor.
These articles are provided for information purposes only. Occasionally, an opinion about whether to buy or sell a specific investment may be provided by third parties. The content is not intended to be a personal recommendation to buy or sell any financial instrument or product, or to adopt any investment strategy as it is not provided based on an assessment of your investing knowledge and experience, your financial situation or your investment objectives. The value of your investments, and the income derived from them, may go down as well as up. You may not get back all the money that you invest. The investments referred to in this article may not be suitable for all investors, and if in doubt, an investor should seek advice from a qualified investment adviser.
Full performance can be found on the company or index summary page on the interactive investor website. Simply click on the company's or index name highlighted in the article.
Disclosure
We use a combination of fundamental and technical analysis in forming our view as to the valuation and prospects of an investment. Where relevant we have set out those particular matters we think are important in the above article, but further detail can be found here.
Please note that our article on this investment should not be considered to be a regular publication.
Details of all recommendations issued by ii during the previous 12-month period can be found here.
ii adheres to a strict code of conduct. Contributors may hold shares or have other interests in companies included in these portfolios, which could create a conflict of interests. Contributors intending to write about any financial instruments in which they have an interest are required to disclose such interest to ii and in the article itself. ii will at all times consider whether such interest impairs the objectivity of the recommendation.
In addition, individuals involved in the production of investment articles are subject to a personal account dealing restriction, which prevents them from placing a transaction in the specified instrument(s) for a period before and for five working days after such publication. This is to avoid personal interests conflicting with the interests of the recipients of those investment articles.