Commodities outlook: Is oil heading to $84?
9th July 2018 12:50
by Rajan Dhall from interactive investor
Industry analyst Rajan Dhall discusses where investors should expect oil, gold and copper prices to move this week.

With gold, all the talk is about correlations with risk and the US dollar (USD), and there have been days when stocks can rise along with gold in a risk-on environment.
Gold has moved away from assets like fixed income, the Japanese yen (JPY) and Swiss franc (CHF), so what is it following?
The answer is the Chinese yuan (CNY). USD/CNY movement has been the closest relation to price action in gold for a while now. Some analysts note that it could actually be the Chinese who are selling gold reserves to profit from dollar strength, only to buy it back at a lower price.
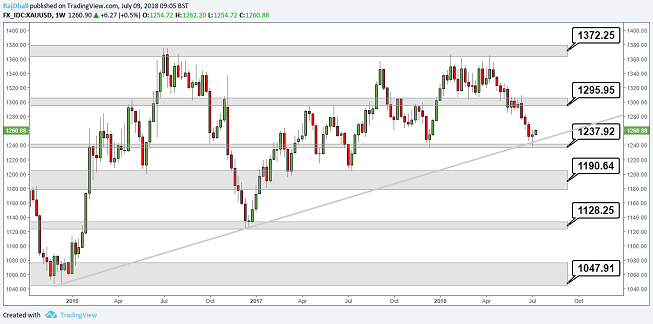
On the technical front, you can see from the weekly chart below that price has started to stabilise and bounced off the trend-line which originated in 2016. This doesn't mean the historical correlations are finished. If stocks tanked, we would still be looking at gold as a safe haven asset class and, if the trade wars continue, it may well be a safe bet.

Past performance is not a guide to future performance
The biggest loser in this trade war is base metals. If tariffs are put in place worldwide it's reasonable to expect infrastructure will suffer.
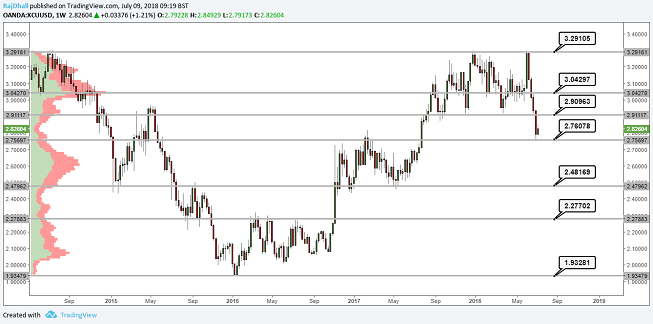
Copper has had a terrible few weeks, and you can see in the weekly chart below it’s lost around 14% of its value. Depending on what is said, there is always the chance that it could go lower but, for now, it has finally found some support at the early 2017 wave high.
Data out of China has not been world beating but it is still solid, and the latest round of rumours from Escondida in Chile is that miners are still working on strike action over conditions and pay (bullish for copper).
The fate of copper effectively rests in the hands of President Trump and China's Xi, so keep a close eye on any comments as they could have a significant impact.

Past performance is not a guide to future performance
Oil markets are still in bullish mode as tensions mount.
Iran is at the centre of fears here, with the US stance drawing retaliatory comments which have drawn the all-important Strait of Hormuz into the mix. The Iranian government said last week it could look at blocking the zone which is used by most of the Gulf countries to ship out the black stuff, though this statement was later retracted.
It would not be the first time Iran has used this threat, but naturally they are aggrieved by US actions and at the moment anything is possible.
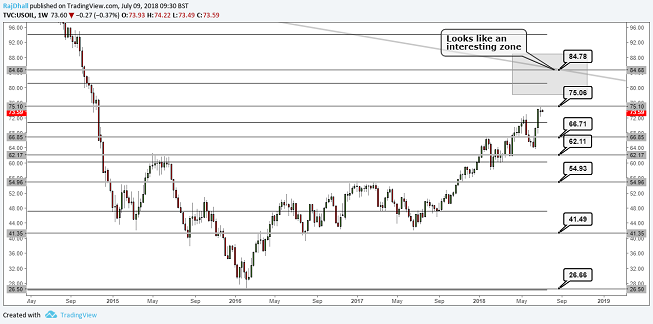
Looking at the chart now, the price has struggled to break out to make a new high, but the $84/barrel area catches the eye. There is a strong 61% Fibonacci level in confluence with resistance from an old price level and a descending trend-line.

Past performance is not a guide to future performance
These articles are provided for information purposes only. Occasionally, an opinion about whether to buy or sell a specific investment may be provided by third parties. The content is not intended to be a personal recommendation to buy or sell any financial instrument or product, or to adopt any investment strategy as it is not provided based on an assessment of your investing knowledge and experience, your financial situation or your investment objectives. The value of your investments, and the income derived from them, may go down as well as up. You may not get back all the money that you invest. The investments referred to in this article may not be suitable for all investors, and if in doubt, an investor should seek advice from a qualified investment adviser.
Full performance can be found on the company or index summary page on the interactive investor website. Simply click on the company's or index name highlighted in the article.