Glencore takes red pen to oil forecasts
26th October 2018 12:16
by Lee Wild from interactive investor
This third-quarter update was largely in line with expectations, but full-year guidance has been reduced in places, reports Lee Wild.

Glencore, currently helping a US Department of Justice (DoJ) investigation into alleged corruption at intermediaries, has lost a quarter of its value in 2018, and today's third-quarter production update has failed to prevent the shares falling further in what are currently difficult stockmarket conditions.
Apart from a cut in guidance for annual oil output, the numbers were largely in line with expectations.
Own sourced copper production was up 12% in the first nine months of 2018 to 1,063 thousand tonnes (kt), reflecting a resumption of processing operations at Katanga in the Democratic Republic of Congo. The restart also had a positive impact on production of own sourced cobalt, up 44% year-on-year to 28,500 tonnes.
Glencore kept full-year guidance for both unchanged. Expect 1,445 to 1,485kt of copper and 37-41,000kt of cobalt, both of which the market agrees are achievable.
• Glencore and two other top picks in the mining sector
• Glencore's route to a record high
Zinc output fell by 5% to 786,000 tonnes, although that is blamed largely on last year including 92,100 tonnes of zinc from the African assets sold to Trevali Mining. Adjust for the disposal and production was actually up 7% at 50,700 tonnes.
Elsewhere, the ramp-up of Koniambo grew nickel output by 13%, while ferrochrome was flat on the year before.
Oil production fell by 0.5 million barrels, or 14%, to 3.4 million barrels (mmbl) after an explosion forced Glencore to temporarily suspend operations at its Mangara oilfield in Chad for a month. We're told the field is now back online and fully operational.
Coupled with the natural field decline rate in the liquids phase at the offshore fields in Equatorial Guinea, Glencore now expects output of only 4.4-4.8 mmbl in 2018, down by 0.3 mbbl, or 6% on previous guidance and below 2017 production of 5.1 mmbl.
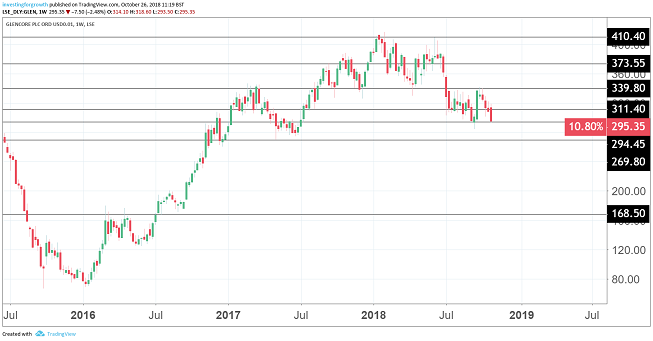
Source: TradingView weekly chart (*) Past performance is not a guide to future performance
*Horizontal lines on charts represent levels of previous technical support and resistance
These articles are provided for information purposes only. Occasionally, an opinion about whether to buy or sell a specific investment may be provided by third parties. The content is not intended to be a personal recommendation to buy or sell any financial instrument or product, or to adopt any investment strategy as it is not provided based on an assessment of your investing knowledge and experience, your financial situation or your investment objectives. The value of your investments, and the income derived from them, may go down as well as up. You may not get back all the money that you invest. The investments referred to in this article may not be suitable for all investors, and if in doubt, an investor should seek advice from a qualified investment adviser.
Full performance can be found on the company or index summary page on the interactive investor website. Simply click on the company's or index name highlighted in the article.