AstraZeneca shares continue assault on record high
A poor end to 2018 spilled over in to this year, but the bulls are back in charge after these results.
14th February 2019 13:45
by Graeme Evans from interactive investor
A poor end to 2018 spilled over in to this year, but the bulls are back in charge after these results.

Having comfortably outperformed the FTSE 100 index in 2018, AstraZeneca (LSE:AZN) shares were back on form today as the drugs giant revealed forecast-beating Q4 sales driven by new medicines including lung cancer treatments Tagrisso and Imfinzi.
The 4% rise in full-year product sales to US$21 billion is a significant landmark for CEO Pascal Soriot after several years of declines caused by the impact of patent expiries on blockbuster drugs including cholesterol drug Crestor and anti-psychotic medicine Seroquel XR.
The loss of these older drugs is estimated to have cost about half of the group's revenues in the period since Soriot's appointment in 2012, with Astra among the worst-hit pharmas for patent expiries. A new batch of medicines is finally driving growth, however, with today's figures showing these drugs generated incremental sales of $2.8 billion in the 2018 financial year.
Product sales returned to growth in the third quarter, with the performance sustained in the final three months of 2018 following a 5% improvement today. The result endorses the strategy set out by Soriot a few years ago — and one severely tested in 2014 when US-based rival Pfizer came calling with a takeover offer priced at £55 a share.
Soriot and the Astra board stood their ground, placing faith in their pipeline-driven transformation. It's taken a while to get there, particularly after several portfolio setbacks, but Astra's shares finally passed the Pfizer mark last July.
They have been above this level ever since, although Soriot's recent plans to restructure R&D into two divisions, split between oncology and biopharmaceuticals, caused some market jitters at the start of 2019.
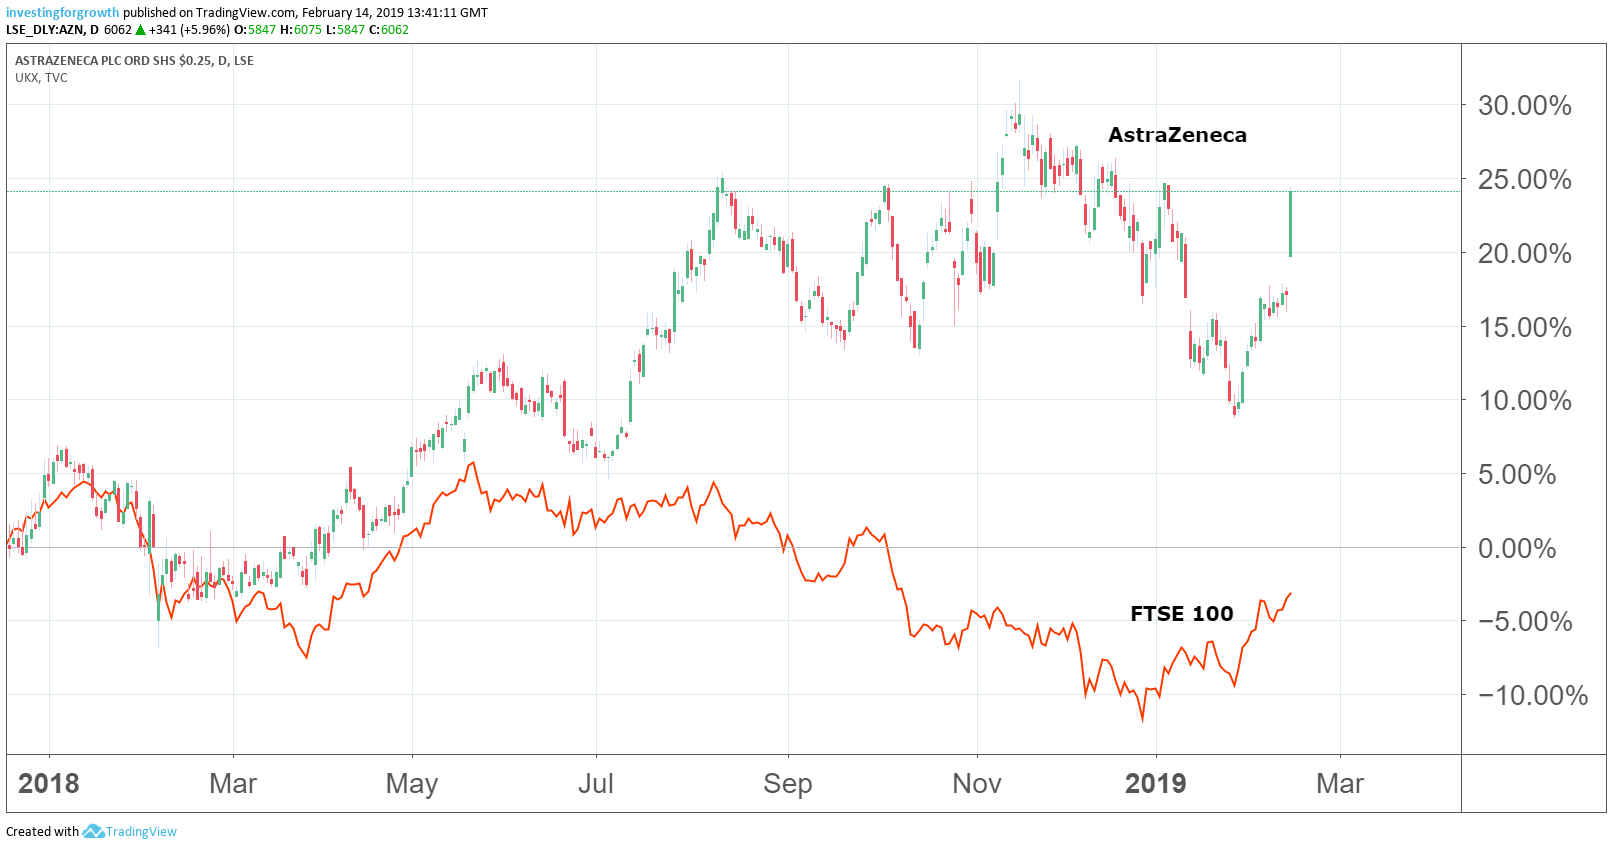
Source: TradingView (*) Past performance is not a guide to future performance
The stock resumed its ascent today with a 5% surge back above 6,000p, moving it within sight of the all-time high of 6,317p seen in November. Shares are clearly not cheap, with a current price/earnings (PE) multiple of more than 30x leaving little room for manoeuvre in the event of a failed drug trial, for example. However, Astra also offers investors a steady income thanks to its 3.5% dividend yield.
As well as the promise of Astra's newer drugs, there's also the potential offered by growth in emerging markets and China, where sales at constant exchange rates were up 13% and 25% respectively last year. China accounted for 16% of all Astra sales last year.
Overall, UBS said reported fourth quarter sales were 2% higher than consensus, helped by a "high quality sales beat from young products". These included Tagrisso and Imfinzi each doubling sales to help oncology revenues increase 49% in the full year. The figure was up 61% in the final quarter, representing almost a third of all product sales.
The growth of Tagrisso also means it is on course to be Astra's biggest-selling medicine in 2019.
Astra added that Fasenra, its severe asthma medicine, generated sales of $297 million in its first full year after "performing exceptionally well in the countries where it was launched".
UBS noted that operating expenditure was substantially higher than forecast, leading to an earnings per share miss of 12% in the quarter when one-off tax effects are excluded.
In terms of 2019 performance, Astra is forecasting high single-digit constant exchange rate growth in sales and core EPS of $3.50 to $3.70, compared with $3.46 in 2018.
Soriot said: "Our strategy and plans remain unchanged, with sales growth and a focus on cost management anticipated to drive growing operating profit.
"I'm pleased that we are fully on track to meet these commitments as we build a sustainable level of growth and a pipeline that is benefitting more and more patients around the world."
*Horizontal lines on charts represent levels of previous technical support and resistance. Trendlines are marked in red.
These articles are provided for information purposes only. Occasionally, an opinion about whether to buy or sell a specific investment may be provided by third parties. The content is not intended to be a personal recommendation to buy or sell any financial instrument or product, or to adopt any investment strategy as it is not provided based on an assessment of your investing knowledge and experience, your financial situation or your investment objectives. The value of your investments, and the income derived from them, may go down as well as up. You may not get back all the money that you invest. The investments referred to in this article may not be suitable for all investors, and if in doubt, an investor should seek advice from a qualified investment adviser.
Full performance can be found on the company or index summary page on the interactive investor website. Simply click on the company's or index name highlighted in the article.