Barclays shares and a tale of two trends
Investors following this high street bank share, and indeed existing shareholders, have two trend lines to track, but which is the right one? Independent analyst Alistair Strang reveals which one he's paying more attention to.
27th November 2023 07:45
by Alistair Strang from Trends and Targets
Barclays (LSE:BARC) is proving a bit greedy, even by banking standards! For the last few years, the share price has developed a “Why bother with one uptrend, when you can have two?” It’s almost like a deliberate attempt is taking place to confuse the markets, especially as both trend lines may be thought of as equally valid.
Of course, the perennial question must be, which one is the most valid?
The answer, obviously, is impossible to say, as despite the price breaking trend, it has yet to achieve any really convincing targets. However, despite this, the share price needs to close a session above just 144.6p to suggest all this trend break stuff is nonsense. The reason there are two trends, which bothers us, is shown below.
- Invest with ii: Open a Stocks & Shares ISA | ISA Investment Ideas | Transfer a Stocks & Shares ISA
On the upper chart, the lower Red trend line represents the low of the day and dates back to 2020. Circled on 24 October, in a completely random act, the market chose to manipulate the share price at the start of trade, gapping it solidly below the conventional Red uptrend.
What was especially curious about this completely random act was the price was also opened below the Green closing price trend, which also dated back to 2020. Our inclination is to embrace a suspicion the market really wants Barclays share price to reverse as, by any standards, the manipulation at the market open on 24 October was quite emphatic.
We use the term ‘manipulation’ quite unapologetically, the price movement being decided prior to any actual trades taking place. Anyone with access to market charts can easily recreate this and wonder just what the market is playing at. Our perspective is to pay more attention to the Green closing price uptrend as it starts to appear that’s the one the market is actually playing with.
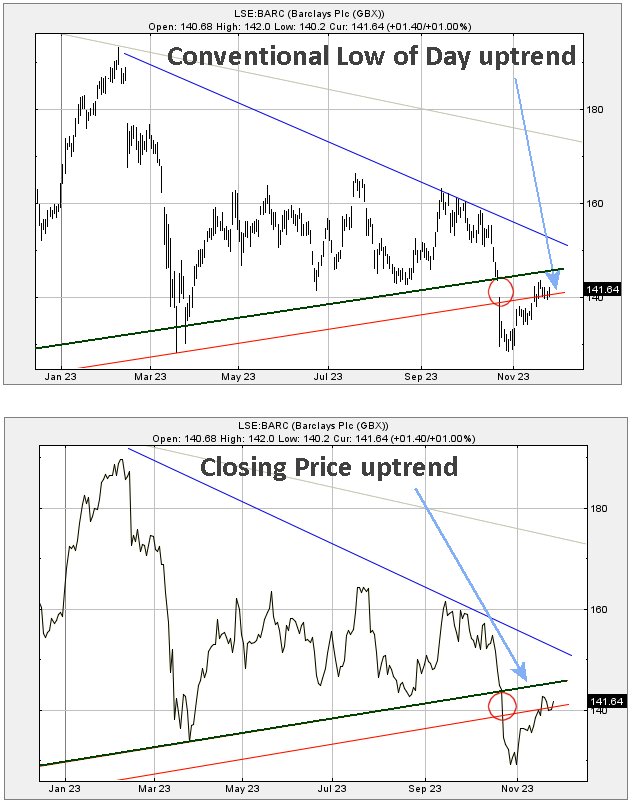
Source: Trends and Targets. Past performance is not a guide to future performance.
From an immediate perspective, we are fairly cynical on what’s coming next. Below just 138p calculates with the potential of reversal to an initial 130p with our longer term secondary, if broken, working out at a future 120p, along with a vague potential for a bounce.
In the event the 120p level breaks, about the best we dare hope for is a rebound before the 100p level. It is certainly quite odd how the UK feels like it’s prepping each of the Big Three banks for some savage reversals.
However, Barclays need only close a session above 144.6p to ruin our predictions. Above 144.6p looks capable of triggering surprise recovery to an initial 152p with secondary, if exceeded, an eventual 160p and some potential hesitation, given share price behaviour at this level during this year.
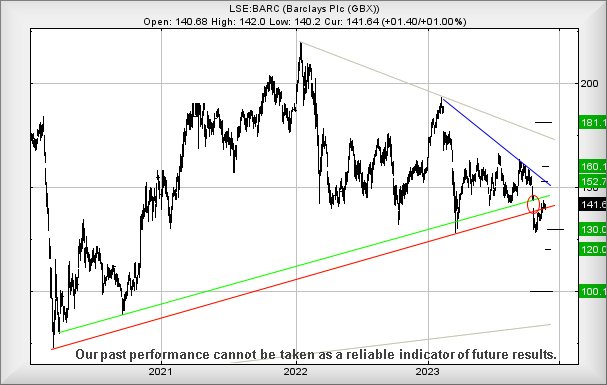
Source: Trends and Targets. Past performance is not a guide to future performance.
Alistair Strang has led high-profile and "top secret" software projects since the late 1970s and won the original John Logie Baird Award for inventors and innovators. After the financial crash, he wanted to know "how it worked" with a view to mimicking existing trading formulas and predicting what was coming next. His results speak for themselves as he continually refines the methodology.
Alistair Strang is a freelance contributor and not a direct employee of Interactive Investor. All correspondence is with Alistair Strang, who for these purposes is deemed a third-party supplier. Buying, selling and investing in shares is not without risk. Market and company movement will affect your performance and you may get back less than you invest. Neither Alistair Strang or Interactive Investor will be responsible for any losses that may be incurred as a result of following a trading idea.
These articles are provided for information purposes only. Occasionally, an opinion about whether to buy or sell a specific investment may be provided by third parties. The content is not intended to be a personal recommendation to buy or sell any financial instrument or product, or to adopt any investment strategy as it is not provided based on an assessment of your investing knowledge and experience, your financial situation or your investment objectives. The value of your investments, and the income derived from them, may go down as well as up. You may not get back all the money that you invest. The investments referred to in this article may not be suitable for all investors, and if in doubt, an investor should seek advice from a qualified investment adviser.
Full performance can be found on the company or index summary page on the interactive investor website. Simply click on the company's or index name highlighted in the article.